
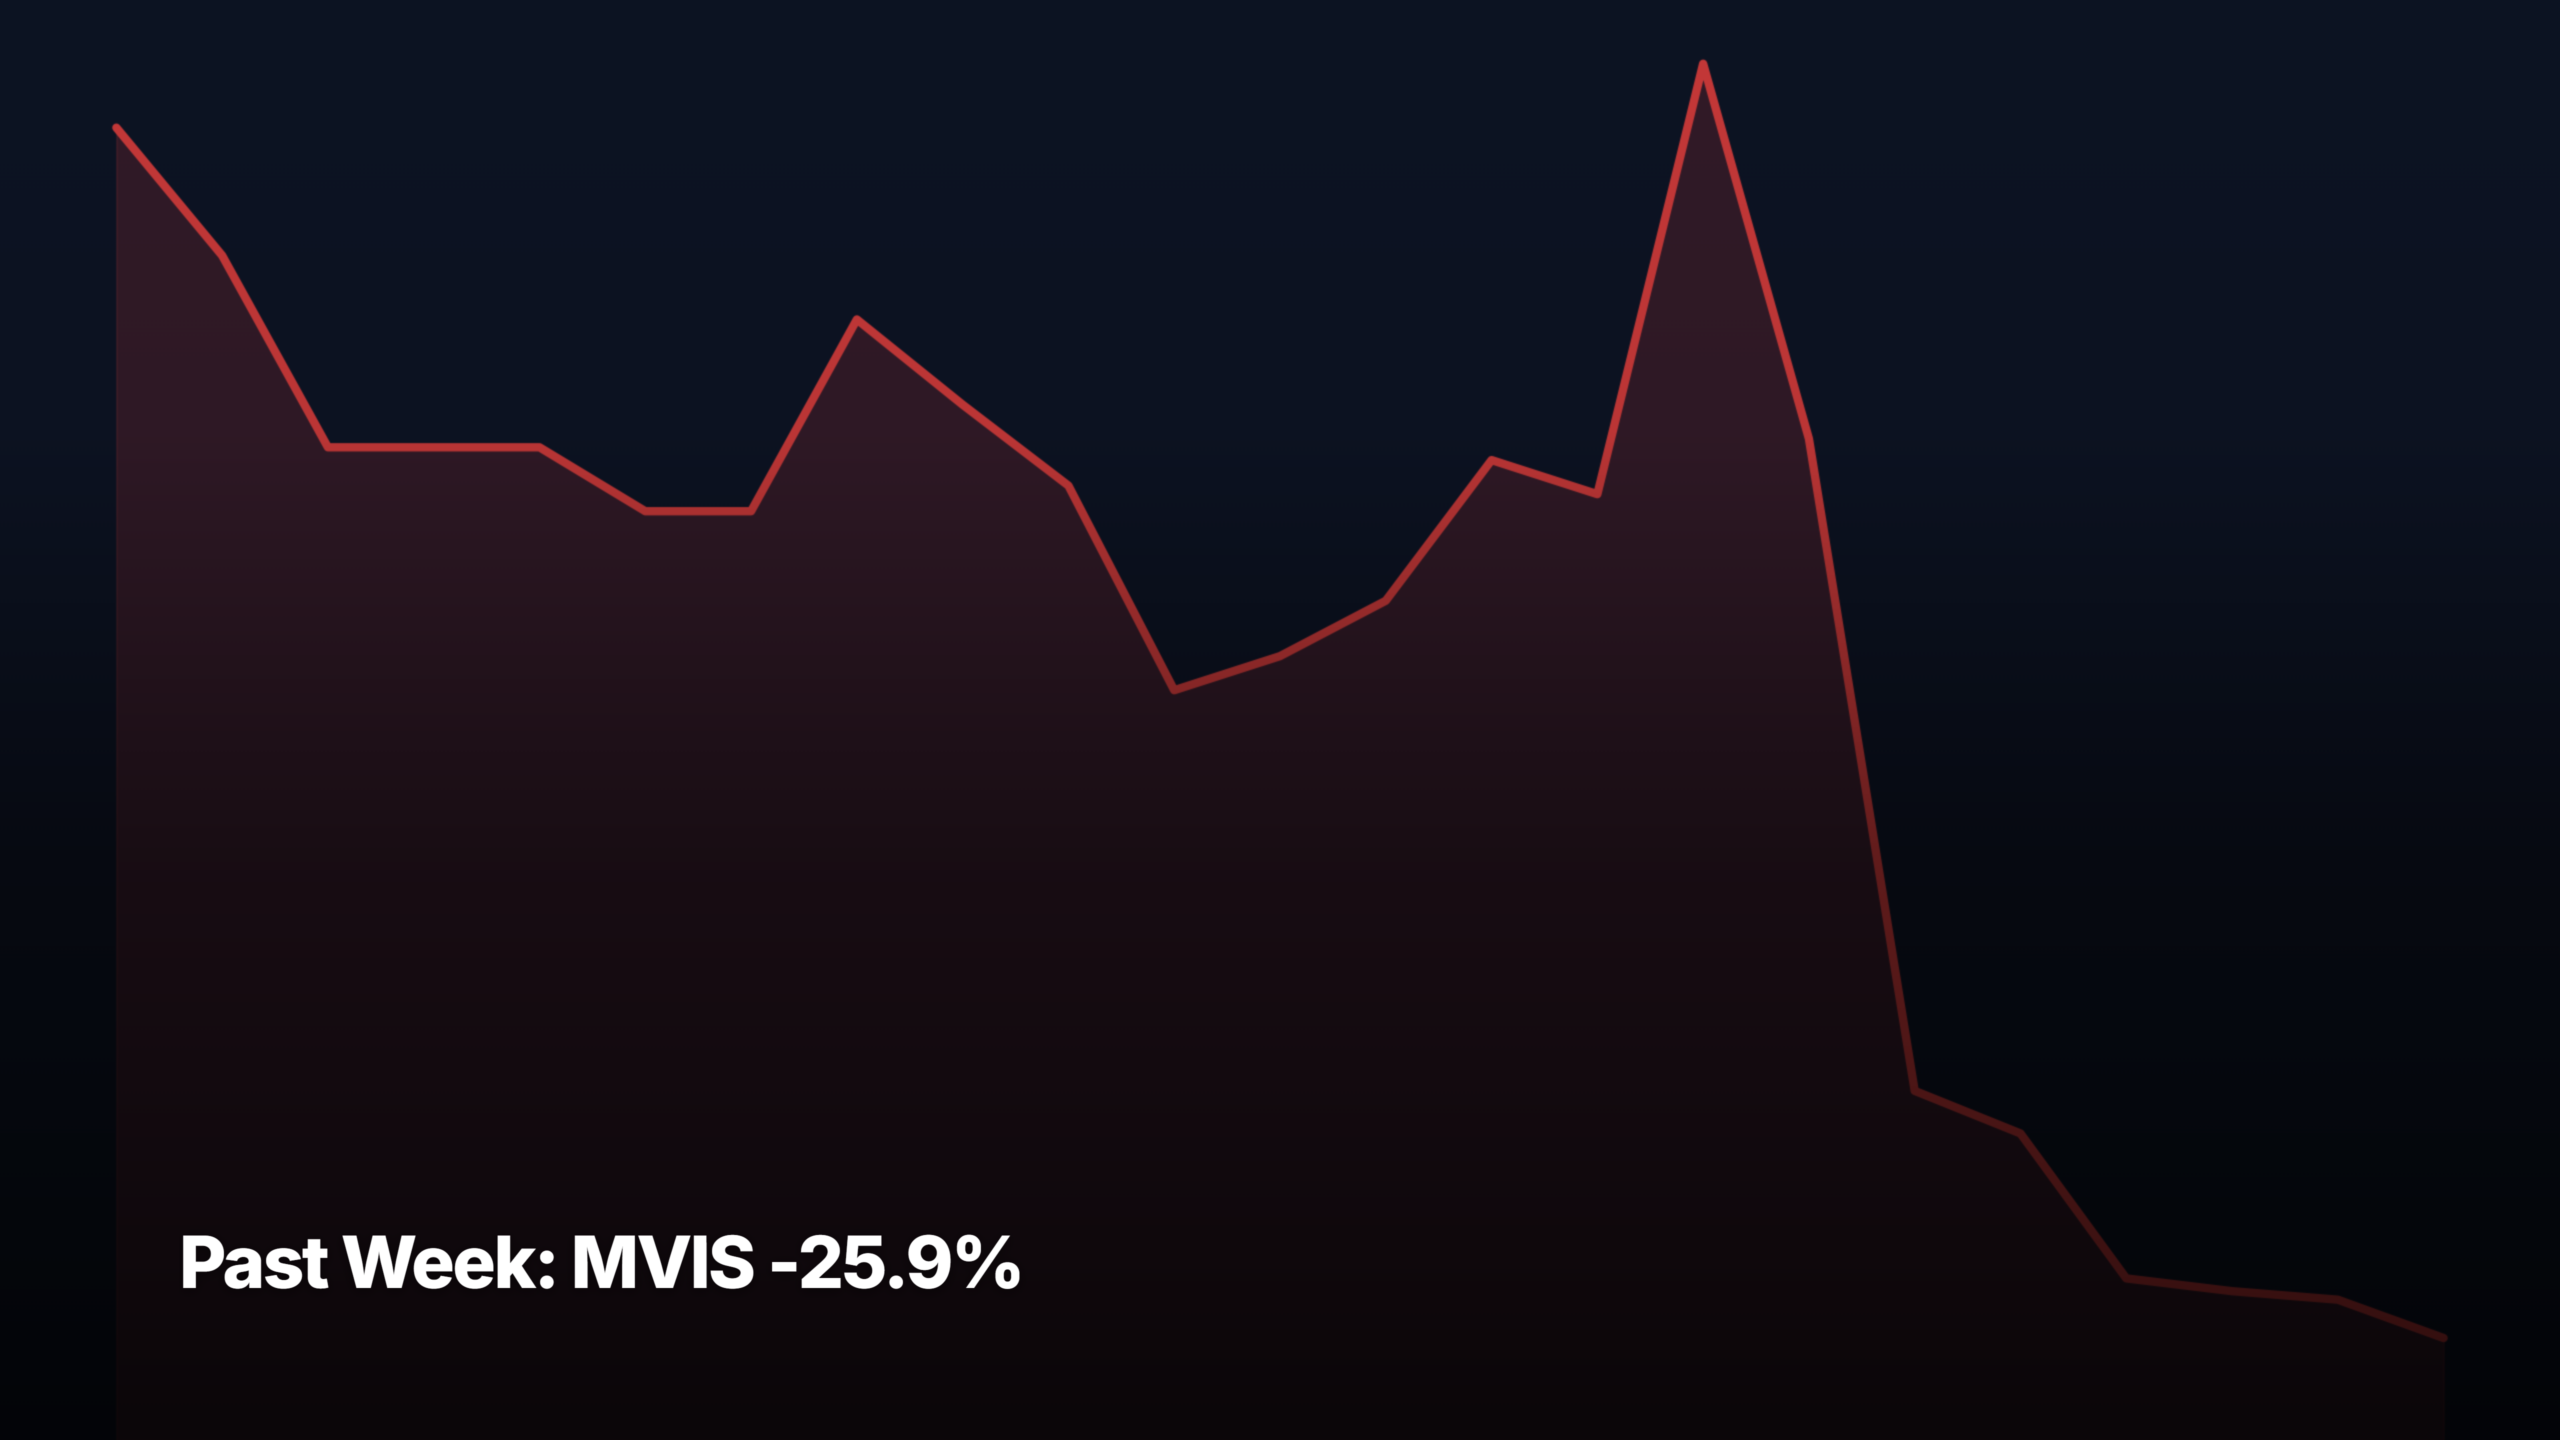
- MVIS -25.9% was the biggest decliner across all cap tiers over the past week through August 21, 2026.
- Top gainer: COIN +25.6% (large-cap). Top decliner: MVIS -25.9%.
- Return spread between the biggest gainer and biggest loser across all tiers was 51.5 percentage points — wide dispersion.
These are the top stock movers for the past week through August 21, 2026, broken down by market-cap tier. MVIS -25.9% was the single biggest move across all four tiers. For each tier, the top 3 gainers and top 3 decliners are listed with a plain-English catalyst note and a pattern-recognition read — whether the move looks like a clean breakout, momentum continuation, mean-reversion bounce, or extended run with reset risk.
Universe: ~145 curated US common stocks (NYSE + Nasdaq, ≥$300M market cap, ≥$1M average daily dollar volume). Cap tier reflects current market cap, not historical.
Mega-cap leaders (above $200B market cap)
Top gainers — past week
1. ↑ MRK +12.30%
$152.55 · avg $2,338M/day · Mega-cap
Why: Cancer vaccine partnership with Moderna drew fresh attention this week, with headlines flagging the Merck-Moderna oncology program and broader spillover into vaccine-adjacent names. A defensive pharma catching a growth-flavored catalyst pulled buyers off the sidelines after a long stretch of underperformance versus large-cap peers.
Pattern: Sharp thrust off a multi-month base — the kind of move that looks like early accumulation rather than late-stage chase. Clean breakout with room overhead, though a +12% week in a mega-cap pharma warrants some cooldown before the next leg.
2. ↑ TMO +6.97%
$629.27 · avg $1,155M/day · Mega-cap
Why: No single clear catalyst — life-sciences tools broadly bid this week alongside the Bio-Rad and Agilent strength cited in headlines. Investors appear to be rotating back into the picks-and-shovels side of biotech as sentiment warms on drug-discovery spending.
Pattern: Steady grind higher off a flat base rather than a sharp gap. Looks like early sector rotation, not an extended move — dispersion within the group suggests room to run if peers keep firming.
3. ↑ LLY +6.38%
$1,255.40 · avg $3,329M/day · Mega-cap
Why: Weight-loss franchise leadership drove another leg higher, with analyst commentary flagging that current multiples still assume conservative growth. A UK regulatory win added a tangible catalyst on top of the ongoing GLP-1 momentum story.
Pattern: Fresh breakout from a multi-week consolidation on a mega-cap that had been digesting a long run. Momentum-intact structure, though $1,255 puts it back near prior highs where supply tends to appear.
Top decliners — past week
1. ↓ WMT -10.04%
$103.70 · avg $4,326M/day · Mega-cap
Why: Q2 earnings landed with US comparable sales flagged as a ‘worst case scenario’ by at least one analyst, spooking a name that had been priced for defensive perfection. The retail readthrough (Target, HD) piled onto concerns about the health of the middle-income consumer.
Pattern: Sharp earnings gap-down that broke the prior uptrend — classic distribution-top signature after a long grind higher. First real break of trend structure in months; needs to stabilize before dip-buyers should get interested.
2. ↓ AMD -8.00%
$473.25 · avg $8,889M/day · Mega-cap
Why: Rotation out of AI hardware ahead of Nvidia earnings, with headlines flagging chip-memory concerns and a Goldman note on Nvidia setup pulling attention (and capital) toward the leader. AMD tends to trade as the higher-beta AI proxy on both sides.
Pattern: Sharp pullback from an extended run — looks more like profit-taking into a binary catalyst (NVDA print) than a trend break. Reset from overbought conditions; watch how it trades post-Nvidia for the real signal.
3. ↓ META -6.77%
$549.90 · avg $9,723M/day · Mega-cap
Why: No single clear catalyst — mega-cap tech broadly softened this week with the S&P posting its first weekly loss since July. Rotation out of high-multiple growth into defensives and value showed up cleanly across FAANG-adjacent names.
Pattern: Orderly pullback from recent highs, not a break of the primary trend. Looks like healthy consolidation of a strong run rather than distribution — reset that could set up a next leg if broader tape stabilizes.
Large-cap leaders ($10B to $200B market cap)
Top gainers — past week
1. ↑ COIN +25.61%
$186.49 · avg $2,359M/day · Large-cap
Why: Bitcoin broke out of its 2026 range and pushed toward $80,000 on US regulatory momentum, dragging every crypto-adjacent name higher. Coinbase gets the double kicker of trading volume tailwinds plus balance-sheet mark-to-market on its own holdings.
Pattern: Explosive breakout from a multi-month base on high volume — textbook momentum ignition. Move is extended after +25% in five sessions, but the base underneath is deep enough that pullbacks should find buyers.
2. ↑ CRM +6.61%
$209.17 · avg $2,661M/day · Large-cap
Why: Positioning ahead of next week’s earnings print, with the name flagged repeatedly in preview coverage alongside Nvidia and Intuit. Software has been a rotation beneficiary as investors trim AI hardware, and Salesforce is one of the cleaner enterprise-AI narrative plays.
Pattern: Bounce off a prior support zone rather than a fresh breakout — feels like a pre-earnings position build. Move is contained; the real read comes after the print and how it holds any post-earnings gap.
3. ↑ INTU +6.17%
$367.00 · avg $1,292M/day · Large-cap
Why: Ran into earnings with option premiums fat enough that covered-call coverage drew commentary. Software rotation plus name-specific anticipation of AI-monetization commentary on the print pulled buyers in.
Pattern: Grinding higher into a known event — pre-earnings drift pattern. Not extended, but the move essentially rents on the print; direction from here is binary based on how the quarter lands.
Top decliners — past week
1. ↓ INTC -12.13%
$90.07 · avg $9,453M/day · Large-cap
Why: Faded a recent rally as the SpaceX/Tesla $16.8B chip fab headline reframed competitive dynamics and reminded holders how crowded the leading-edge foundry race has become. Momentum unwind on a name that had been running on rebound hope more than fundamentals.
Pattern: Sharp reversal after a run — looks like distribution rather than a healthy pullback. Break of near-term structure; needs to hold prior support to prevent trend damage getting worse.
2. ↓ CRWD -11.52%
$191.95 · avg $1,645M/day · Large-cap
Why: Ran into earnings with the setup that a beat may not be enough to satisfy investors, per pre-print commentary. Cyber names got hit as a group (Rapid7, Tenable, Twilio also flagged), pointing to broader software de-risking rather than a company-specific issue.
Pattern: Break of near-term uptrend on group-wide de-risking — classic pre-earnings selling in a crowded name. Reset from overbought; whether this is a buyable dip depends entirely on the print and guide.
3. ↓ DDOG -7.77%
$235.62 · avg $849M/day · Large-cap
Why: Caught in the same software/cyber selloff as CrowdStrike and peers, with the Dynatrace acquisition of Arize also raising questions about competitive positioning in AI observability. High-multiple SaaS bore the brunt of the weekly rotation.
Pattern: Pullback from a recent range high — orderly rather than panicky. Looks like sector-driven de-risking, not a trend break; the multi-week base underneath still holds.
Mid-cap leaders ($2B to $10B market cap)
Top gainers — past week
1. ↑ HIMS +20.00%
$33.78 · avg $447M/day · Mid-cap
Why: Weight-loss pill narrative continued driving flows, with headlines noting the stock has more than doubled in six months. Some noise around card-dispute costs and Novo pushback, but the primary driver is still the GLP-1 telehealth story pulling in growth-hungry buyers.
Pattern: Sharp extension of an already-running trend — momentum-chase pattern. +20% in a week on a name up 100%+ in six months is late-cycle; expect volatile pullbacks that momentum traders will need to sit through.
2. ↑ HOOD +13.15%
$108.13 · avg $2,511M/day · Mid-cap
Why: Direct beneficiary of the Bitcoin breakout — retail trading volumes spike with crypto activity, and HOOD’s crypto revenue line is the most rate-sensitive to price action. Broader risk-on tape from Fed-cut positioning added a second tailwind.
Pattern: Breakout continuation from a base that had been building for weeks — momentum-intact structure. Move rides on crypto strength, so risk is symmetrical: BTC weakness would reverse it just as fast.
3. ↑ RIVN +10.48%
$16.97 · avg $447M/day · Mid-cap
Why: Tesla-adjacent flows drove the group after the Nevada robotaxi permit headline, with Rivian catching a sympathy move alongside broader EV strength. No company-specific catalyst — this looks like beta play in a risk-on tape.
Pattern: Bounce off recent lows rather than a real breakout — mean-reversion in an oversold small-EV name. Move needs company-specific follow-through (production, cash burn) to hold, otherwise it fades with sentiment.
Top decliners — past week
1. ↓ JBLU -13.45%
$4.89 · avg $123M/day · Mid-cap
Why: No single clear catalyst — airline sector weakness with commentary flagging margin concerns even as top-line looks discounted. JBLU tends to trade as the highest-beta name in the group when the sector rolls over.
Pattern: Continuation of an existing downtrend rather than a fresh break — trending decline in a chronically weak name. No sign of a bottom yet; needs sector-level relief before technical setup improves.
2. ↓ FCEL -12.65%
$19.54 · avg $200M/day · Mid-cap
Why: Hydrogen trade split apart this week, with FuelCell, Bloom, and Plug all sliding despite one intraday bounce. No clear company catalyst — sector-level de-rating on the alt-energy complex as investors question the near-term revenue ramp story.
Pattern: Break of a recent bounce — trending decline resuming after a brief consolidation. Sector-driven weakness; needs the whole hydrogen complex to stabilize before individual names look interesting.
3. ↓ ALK -12.08%
$40.41 · avg $109M/day · Mid-cap
Why: Slid alongside JBLU on airline sector weakness despite announcing new Athens and Paris routes from Seattle. The route expansion news usually reads as growth capex, which the market currently doesn’t want to pay for in airlines.
Pattern: Sharp continuation of a post-earnings decline — extended down move that hasn’t found a base yet. Distribution signature; wait for stabilization rather than trying to catch the knife.
Small-cap leaders ($300M to $2B market cap)
Top gainers — past week
1. ↑ MARA +22.39%
$11.26 · avg $725M/day · Small-cap
Why: Bitcoin breakout above $80K lifted every miner, but MARA’s operational leverage makes it one of the higher-beta ways to trade the crypto move. Weekly wrap coverage flagged the sector-wide rally on regulatory momentum.
Pattern: Explosive breakout from a small-cap base on volume — momentum ignition tied directly to BTC. Extended over five sessions; further upside depends entirely on Bitcoin holding its breakout level.
2. ↑ RIOT +4.29%
$19.83 · avg $423M/day · Small-cap
Why: Caught the crypto miner bid but lagged MARA and Strategy, with Duquesne’s new Q2 position drawing investor attention. The bitcoin breakout is the sole driver; company-specific news is thin.
Pattern: Muted participation in a sector move — bounce, not breakout. Suggests RIOT is losing relative strength within the miner group even as the sector rallies; watch for it to catch up or continue lagging.
3. ↑ CHPT +1.13%
$6.25 · avg $2M/day · Small-cap
Why: No single clear catalyst — a barely-positive week on tiny volume ($2M/day) reads as noise rather than a genuine move. EV charging remains out of favor and this is a marginal drift, not a shift in narrative.
Pattern: Sideways drift on collapsed volume — no directional signal. The tape here is essentially dead; needs a real catalyst or sector reawakening to matter.
Top decliners — past week
1. ↓ MVIS -25.89%
$1.66 · avg $6M/day · Small-cap
Why: Hit a fresh 52-week low as flagged in the headlines, with no offsetting company news. Small-cap tech de-risking plus a chronic story of slow commercial traction leaves this name vulnerable in any risk-off tape.
Pattern: Trending decline making new lows — no signs of base formation. Momentum is entirely downward; only a company-specific catalyst breaks this pattern.
2. ↓ STUB -17.33%
$6.68 · avg $52M/day · Small-cap
Why: Post-earnings collapse with analyst outlook resets and consumer-spend concerns around US Open ticket prices sparking a broader wealth-effect discussion. Recent IPO getting its first real test on a rough print.
Pattern: Sharp earnings-driven break — classic post-earnings distribution in a name that hadn’t yet proven itself. Recent IPO with no established support; needs weeks of base-building before it looks interesting again.
3. ↓ CIFR -11.71%
$15.77 · avg $709M/day · Small-cap
Why: Bucked the crypto miner rally — Cipher fell while MARA and RIOT rose. Commentary suggests the market is questioning whether reported revenue is durable given business-line shifts. Bearish read despite the sector tailwind.
Pattern: Relative weakness inside a strong sector move — a red flag. When peers rip and one name doesn’t, that’s usually company-specific selling; extended decline pattern until proven otherwise.
What the past week cohort tells us
The strongest winners came from small- and mid-cap names tied to two distinct narratives: Bitcoin’s breakout above $80,000 (COIN +26%, MARA +22%, HOOD +13%) and healthcare/GLP-1 momentum (HIMS +20%, MRK +12%, LLY +6%). That mix is telling — risk-on flows into crypto-adjacent names AND defensive-flavored pharma catalysts running simultaneously suggests the market is picking winners on stories, not broad beta. The laggard pattern points the other way: WMT’s earnings break, AMD/META rolling over, and cyber/observability software (CRWD, DDOG) getting hit points to consumer-spend caution and rotation out of crowded high-multiple software. Return dispersion is wide (+26% to -26%), which typically signals a stock-picker’s tape rather than an index-driven one. Mega-cap leadership was mixed — three winners, three losers — while small-caps swung hardest in both directions, consistent with a tape being driven by single-name catalysts. Forward-looking: with Nvidia earnings next week and Jackson Hole in focus, expect this dispersion to persist. Position-sizing matters more than direction here; conviction names in the winning narratives (crypto, GLP-1) still have follow-through room, but late-comers are chasing extended moves.
Bottom line
The top stock movers recap covers every US market-cap tier from mega ($200B+) to small ($300M-$2B). The Past Week view shows sustained leadership and sector rotation — complementary to the daily session recap (single-session moves, Tue-Sat morning Melbourne time).
Get early access to Orbit
Orbit is Luna3.ai’s AI-augmented research engine. 12 algorithmic signals + a gradient-boosted ML model + an agentic LLM that reads each top pick’s filings and writes a daily thesis with conviction score and catalyst proximity. Three regimes, three playbooks — growth in expansion, defensives in late-cycle, recovery plays at panic bottoms. The 3 in Luna3.ai.
No spam. Unsubscribe any time.
No comments yet. Be the first to share your thoughts!