- $500 a month invested at the S&P 500's long-run ~10% return becomes about $3.16 million over 40 years. The same $500 a month in cash sits at $240,000 — a $2.92 million gap that is entirely compounding.
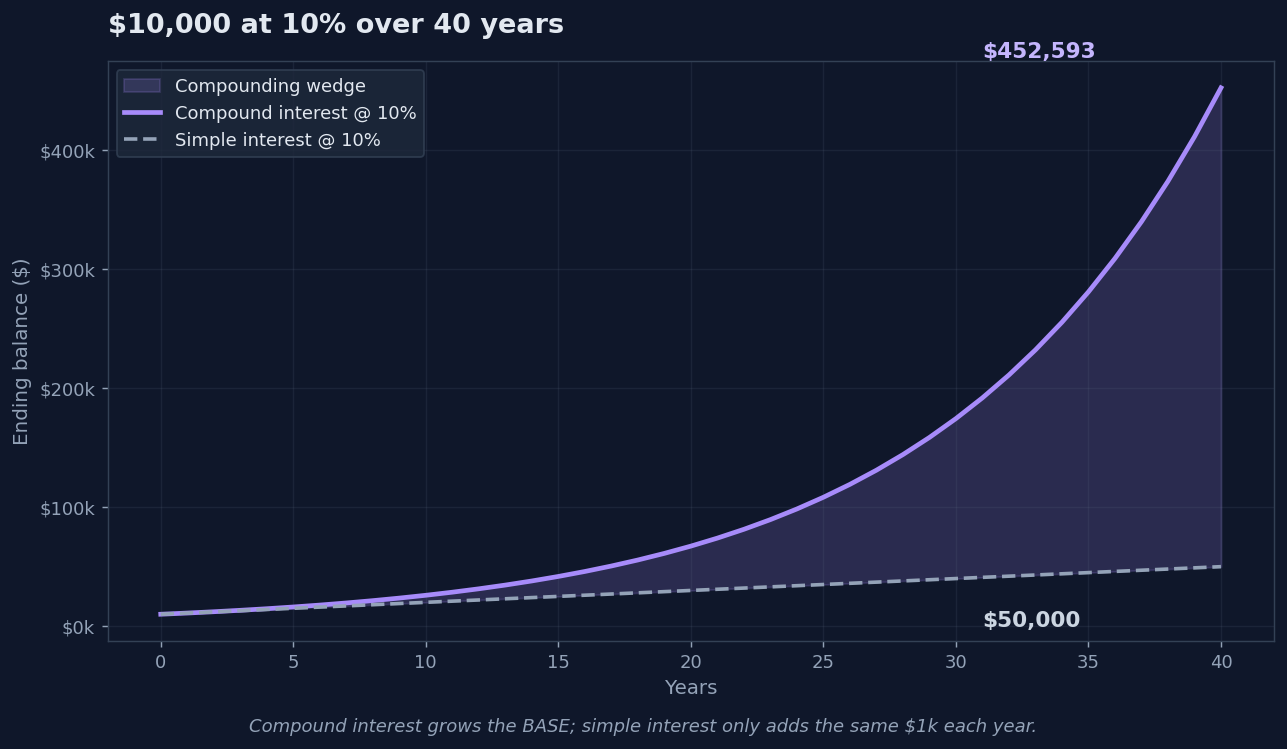
- Compound interest means interest earning interest on itself. The growth curve looks nearly flat for the first decade, then bends hard as the base keeps getting larger.
- Inflation, taxes, market drawdowns, and panic-selling all take bites out of the textbook curve. Compounding still wins — just by a smaller margin than the headline number suggests.
Compound interest is interest that earns interest on itself. When last year’s gains start generating this year’s gains, the growth curve stops being a straight line and starts bending upward — slowly at first, then dramatically. It’s the single most-googled concept in personal finance, and for good reason: it’s the mechanism that turns a $500-a-month habit into roughly $3.16 million over 40 years at the S&P 500’s long-run return. The same $500 a month sitting in cash earns $240,000 over the same window. The roughly $2.92 million gap is compounding, doing its job.
Why this matters
Every retirement account in the United States — 401(k), Roth IRA, Traditional IRA, 403(b), 457, SEP — is built around the same idea: shelter your money from taxes long enough for compounding to bend the curve. The vehicle is just a wrapper. The engine is compounding.
The reason the 40-year horizon matters is that the curve is nearly flat for the first decade. A $10,000 lump sum invested at 10% per year reaches about $25,937 by year 10 — a $15,937 gain that feels uninspiring. By year 30, that same lump sum has grown to $174,494. By year 40, it crosses $452,593. The math hasn’t changed; the base has. Compounding rewards reaching the back half of the curve, which is why “start early” is the single most repeated piece of personal-finance advice that actually pays off.
How compound interest actually works
The textbook formula is short:
A = P (1 + r/n)^(nt)
In plain English: your ending amount (A) equals what you started with (P, the principal), multiplied by one plus your annual rate (r) divided by how many times per year interest compounds (n), all raised to the power of total compounding periods (n × t, where t is years). A 10% annual return compounded once a year for 30 years is simply $10,000 × 1.10³⁰ = $174,494.
The formula matters less than the pattern. Watch what happens year by year on $10,000 at 10%:
- Year 1: Starts at $10,000, earns $1,000 in interest.
- Year 10: Starts at $23,579 (after nine years of compounding), earns $2,358 — more than 2× year one’s gain at the same 10% rate.
- Year 30: Starts at $158,631, earns $15,863 — almost 16× year one’s gain. Same 10% rate; the base is doing the work.
This is the part most beginners miss. The rate didn’t change. The deposit didn’t change. The only thing that changed is the size of the pile that 10% is now operating on. Each year’s interest joins the principal, and next year’s 10% is applied to a larger number. That’s it. That’s the entire mechanism.
The Rule of 72 — a mental shortcut
For a quick mental check, divide 72 by your expected annual return. The result is roughly how many years it takes your money to double.
| Annual return | Rule-of-72 estimate | Actual doubling time |
|---|---|---|
| 4% | 18.0 years | 17.7 years |
| 6% | 12.0 years | 11.9 years |
| 7% | 10.3 years | 10.2 years |
| 8% | 9.0 years | 9.0 years |
| 10% | 7.2 years | 7.3 years |
| 12% | 6.0 years | 6.1 years |
At 10% the Rule of 72 says your money doubles every 7.2 years. Over a 40-year career, that’s about 5.5 doublings — the difference between $10,000 and roughly $450,000 without adding a dollar.
How often does it compound?
Compounding frequency — annual vs. monthly vs. daily — does matter, just less than most articles suggest. $10,000 at a 10% nominal annual rate over 30 years ends at $174,494 with annual compounding, $198,374 with monthly compounding, and around $200,837 with daily compounding. The jump from annual to monthly adds roughly $23,880 (a 13.7% bump); the jump from monthly to daily adds less than $2,500 on top. Stock returns compound effectively continuously in markets, so this is mostly a savings-account concern. The bigger lever for long-term wealth is years invested, not compounding frequency.
Where beginners get confused
Most explainers stop at the formula. The honest version of the story has four caveats that don’t fit on a calculator.
1. Inflation eats the nominal curve
The S&P 500’s long-run ~10% nominal return is what shows up on screens. After roughly 3% long-run US inflation, the real (purchasing-power) return is closer to 6.8%. The $3.16 million headline number from a 40-year $500/month plan is worth roughly $970,000 in 2026 dollars. Still life-changing; still smaller than the headline suggests. Always think in real returns when planning multi-decade horizons.
2. Taxes shave the rate
In a regular taxable brokerage account, dividends and realized capital gains are taxed every year — and that drag shows up as a lower effective compounding rate. Depending on your bracket, taxable-account returns can run one to two percentage points below the underlying market return. Tax-advantaged accounts (Roth IRA, 401(k), Traditional IRA, HSA) preserve more of the curve because the IRS waits until withdrawal — or never collects at all in the case of a Roth.
3. The average hides the path
A “10% average return” can mean +30% in year one, then –20%, then +25% — or any of a million other sequences. For someone in accumulation (still adding to the account), the order barely matters; the compounding math gets the same endpoint. For someone in withdrawal (retirement), order matters enormously. A 30% drawdown in your first retirement year, while you’re also withdrawing, can permanently break the curve. This is called sequence-of-returns risk, and it’s why retirement planning shifts from “maximise returns” to “manage volatility” around 5–10 years before you stop working.
4. Behavior beats math
The single biggest leak in retail compounding isn’t fees, isn’t taxes, isn’t bad fund picks. It’s the investor selling near the bottom of a drawdown and waiting to “feel better” before buying back in. Compounding requires staying invested through periods that feel terrible. The 2020 COVID crash, the 2022 rate-shock drawdown, the 2008 financial crisis — every one of those was a buying opportunity in hindsight and a panic moment in the moment. If you want the textbook curve, you have to sit through the parts that look like the textbook is wrong.
Going deeper
If compound interest is the engine, the next set of questions is about the wrapper, the cadence, and the tax shelter you put around it:
- For the mechanics of “buy a little every month so the math compounds on your contributions, not just your principal,” see What Is Dollar-Cost Averaging? The 20-Year Math.
- For the “just got a bonus, inheritance, or RSU vest — should you lump-sum it or DCA it?” decision, see Lump Sum vs DCA: What to Do When You Get a Windfall.
- For the tax-shelter that preserves the most of the compounding curve over a 30-year career, see Roth vs Traditional IRA: The Breakeven Math Nobody Shows You.
For a US-government-built calculator that lets you plug in your own numbers, the SEC’s Investor.gov compound interest calculator is the most authoritative free option. For the long-run inflation series used in real-return math above, the BLS Consumer Price Index lives at FRED’s CPIAUCSL page.
Compound interest isn’t a trick or a secret. It’s just what happens when you stop interrupting it.
Get early access to Orbit
Orbit is Luna3.ai’s AI-augmented research engine. 12 algorithmic signals + a gradient-boosted ML model + an agentic LLM that reads each top pick’s filings and writes a daily thesis with conviction score and catalyst proximity. Three regimes, three playbooks — growth in expansion, defensives in late-cycle, recovery plays at panic bottoms. The 3 in Luna3.ai.
No spam. Unsubscribe any time.
No comments yet. Be the first to share your thoughts!