
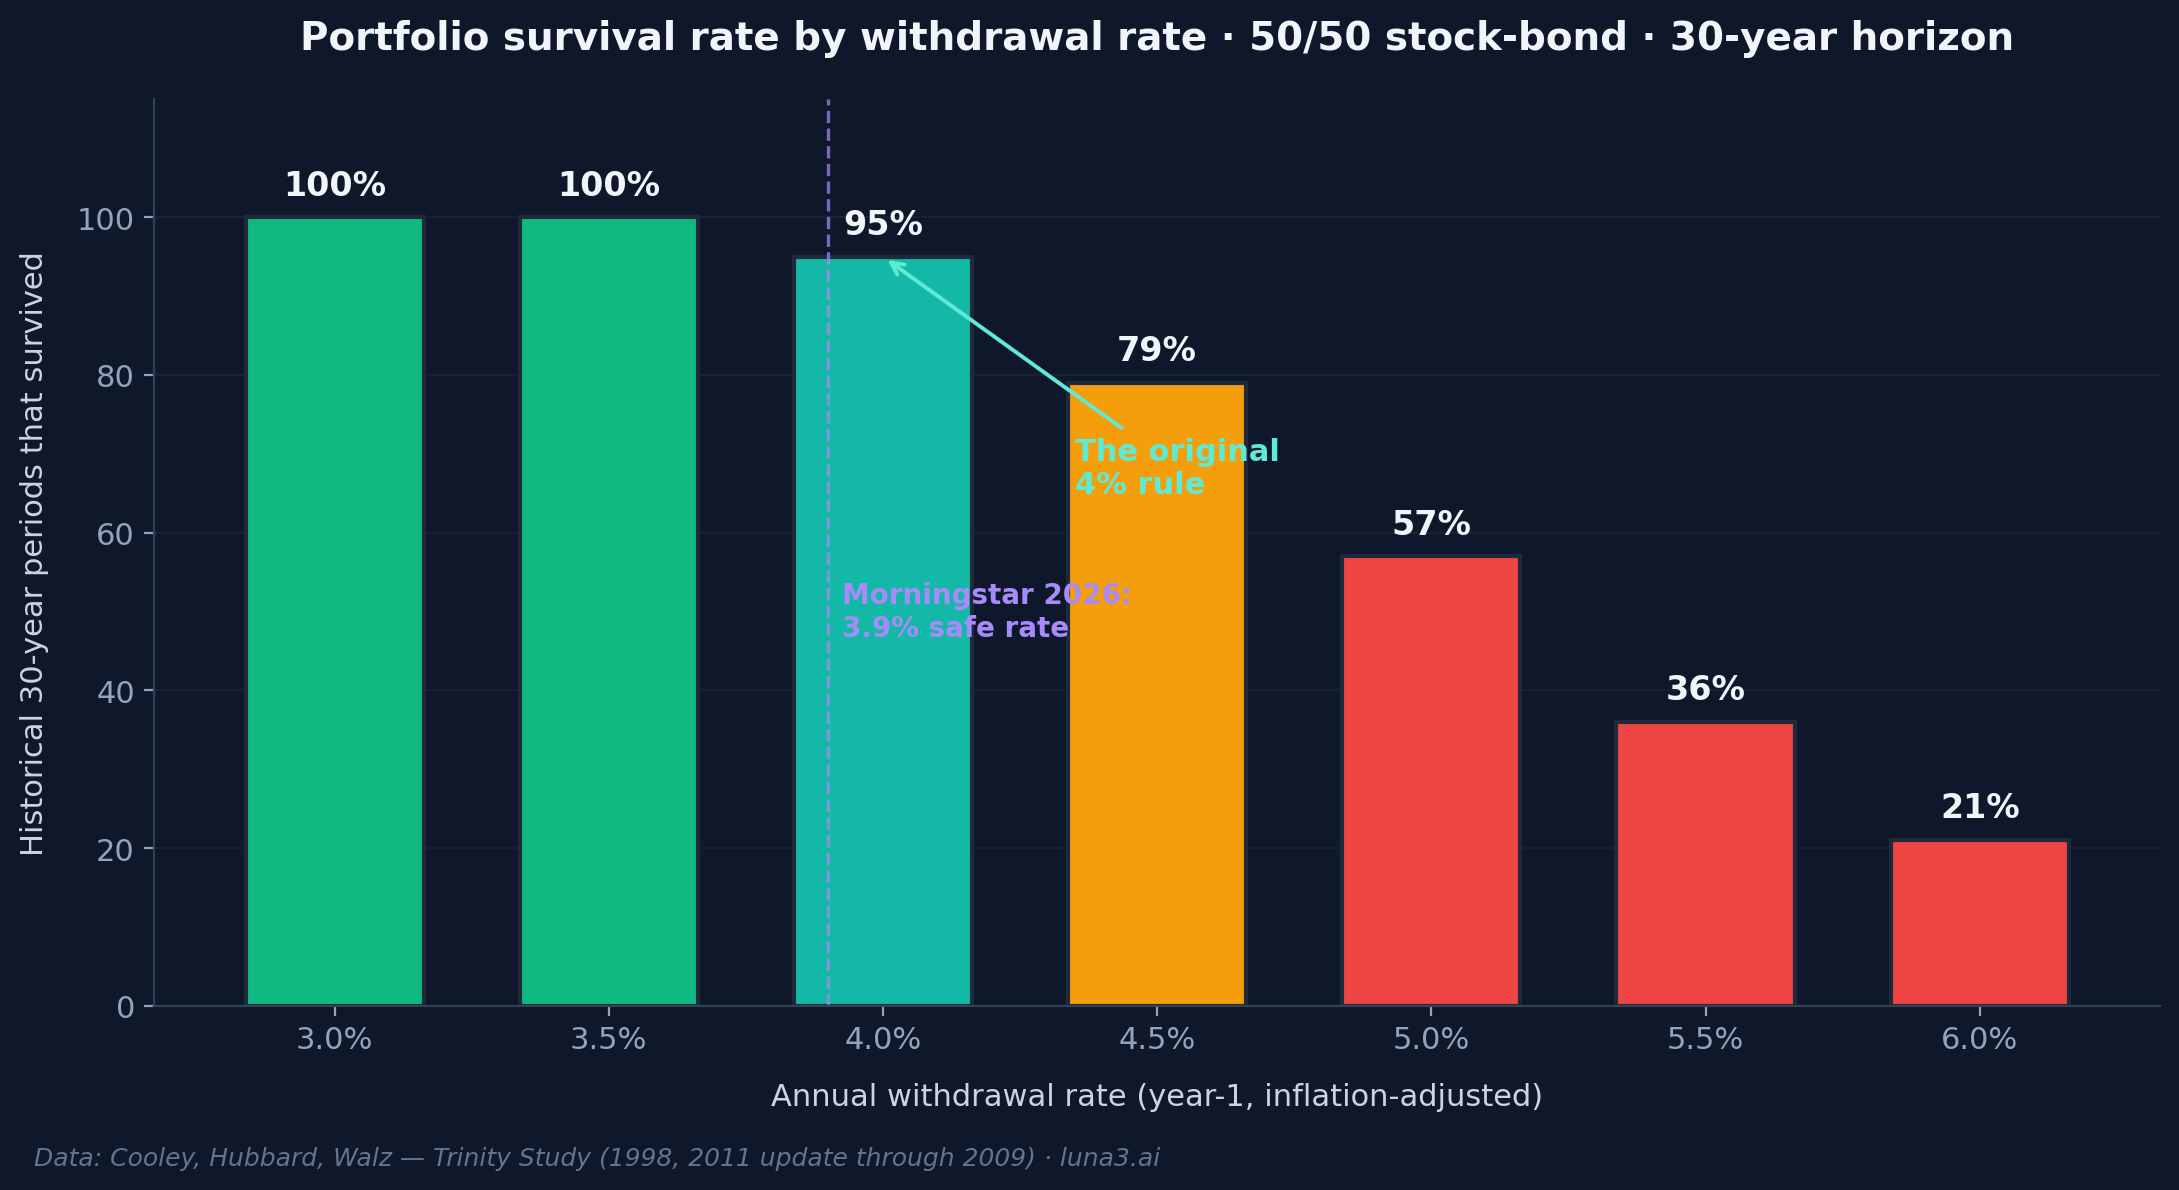
- The 4 percent rule says you need 25× your planned annual spending invested to retire — the Trinity Study (1998) backtested it against US market history and found 95% of 50/50 portfolios survived 30 years.
- Morningstar updates the rate every year using forward-looking assumptions; for 2026 the base case is 3.9%, which translates to roughly 26× annual spending — slightly more conservative than the original 4 percent rule.
- Three things move the answer: your time horizon (early retirees need 3.0-3.5%), your asset allocation (more bonds = lower safe rate), and your Social Security offset (subtract SS before applying the multiplier).
The simplest retirement question — “How much is enough?” — has a one-line answer that most personal-finance guides bury under three pages of caveats. The 4 percent rule says: take your planned annual spending, multiply by 25, and that’s the portfolio number you’re aiming for. Want $60,000 per year in retirement? You need $1.5 million invested.
The rule was published in 1998, refined every decade since, and updated again last December. Most write-ups still get the math wrong, the conditions wrong, or both. Here’s how the rule actually works, where Morningstar’s latest research lands for 2026, and which mistakes turn an honest framework into a comfortable lie.
The trap most guides set
Most retirement guides start with “it depends,” list a handful of factors, and stop there. Helpful for the writer; useless for the reader. The 4 percent rule is one of the few personal-finance heuristics that actually does have a clean answer — when you understand the conditions it was built for.
The rule isn’t a guess. It’s the output of a specific historical experiment with specific inputs: a US S&P 500 stock allocation, long-term corporate bonds, a 30-year horizon, and withdrawals that bump up for inflation every year. Those inputs matter. Change them and the answer moves. The trap is that most guides quote the 4 percent rule without quoting its conditions, then close with “talk to an advisor.” We’re going to do the opposite — explain the conditions, then give you the math you can plug your own numbers into.
How the 4 percent rule actually works
The rule comes from the Trinity Study, formally “Retirement Savings: Choosing a Withdrawal Rate That Is Sustainable,” published by Philip Cooley, Carl Hubbard, and Daniel Walz of Trinity University in the February 1998 issue of the AAII Journal. The authors used Ibbotson historical data from 1925-1995 (later updated through 2009) to backtest combinations of stock and bond allocations against 30-year withdrawal periods.
The mechanic, step by step:
- Year 1: withdraw 4% of your starting portfolio. A $1 million portfolio means $40,000 in year one.
- Year 2 and beyond: take last year’s dollar amount and bump it up for inflation. If CPI rose 3%, year two’s withdrawal becomes $41,200. The dollar figure ratchets up; the percentage of the portfolio you withdraw drifts.
- Continue for 30 years. “Success” means the portfolio didn’t hit zero before the 30 years were up.
The historical result, from the original Trinity Study and its updates:
- 50/50 stock-bond: 95% of all rolling 30-year periods survived at the 4% withdrawal rate.
- 75-100% stocks: 95-98% success — stock-heavy portfolios held up best over long horizons.
- 100% bonds: success rate drops sharply — bonds alone can’t outrun inflation-adjusted withdrawals over 30 years.
Across every rolling 30-year window in the data, 95 out of 100 retirees with the 50/50 allocation never ran out of money at a 4% withdrawal rate. The five who did were the unlucky few who retired right before catastrophic decades — early 1929 being the worst — and were forced to sell shares at depressed prices in the first years of the sequence.
Before the Trinity Study, retirement-income advice mostly meant “withdraw your portfolio’s yield” — fine in the 1980s when 10-year Treasuries paid double-digit yields, useless in the 2010s when they paid 1.5%. Trinity was the first paper to test withdrawal sustainability against actual historical sequences, including the bad ones. That’s why the 4 percent number has lasted three decades.
The 2026 numbers (and where the research landed)
The 4 percent rule has aged. Morningstar updates a successor figure every year in its “State of Retirement Income” research, using forward-looking return assumptions rather than Ibbotson-era historicals. The trajectory tells the story:
- 2022: 3.3% (the trough — bond yields had collapsed, equity valuations were rich)
- 2023: 4.0%
- 2024: 3.7%
- 2025: 3.7%
- 2026: 3.9% — the current base case (State of Retirement Income: 2025 Edition, published December 3, 2025)
The 2026 figure assumes a 30-50% equity allocation (more conservative than Trinity’s stock-heavy tests), a 30-year horizon, and a 90% probability of having portfolio funds remaining at the end. At 3.9%, the “25× rule” becomes the 26× rule (1 ÷ 0.039 ≈ 25.6 — round up for conservatism). A modestly bigger nest egg, same logic.
One offset most calculations skip: the average Social Security retired-worker benefit was $1,907/month in 2024 — $22,884 per year. You only need the portfolio to cover the gap between your annual spend and what Social Security covers. Here’s what the math looks like at both rates, with and without the average SS offset:
| Annual spend | Net of avg SS ($22,884/yr) | At 4% (25× — Trinity) | At 3.9% (26× — Morningstar 2026) |
|---|---|---|---|
| $40,000 | $17,116 | $428,000 | $439,000 |
| $50,000 | $27,116 | $678,000 | $695,000 |
| $60,000 | $37,116 | $928,000 | $952,000 |
| $80,000 | $57,116 | $1.43M | $1.46M |
| $100,000 | $77,116 | $1.93M | $1.98M |
| $120,000 | $97,116 | $2.43M | $2.49M |
Two readings: a household that genuinely spends $60,000 in retirement needs roughly $928K-$952K saved — not $1.5M. And the gap between the 4% and 3.9% columns is real but not catastrophic. The bigger driver is the SS offset, which almost no online “retirement calculator” applies by default.
Where beginners go wrong
Four mistakes turn the rule from a useful framework into a misleading shortcut:
1. Using gross income instead of net spending. Retirement spending is typically 70-80% of pre-retirement income — Fidelity research shows actual retirees land anywhere between 55% and 80%, and longer-horizon studies put the range at 54-87%. Either way: applying the 25× multiplier to your gross salary inflates the target by 20-30%. Run it on what you actually spend, not what you earn.
2. Ignoring sequence-of-returns risk. A 30% drawdown in year one of retirement is far more damaging than the same drawdown in year twenty. The reason: you’re selling shares at depressed prices early in the sequence, leaving fewer shares to compound through the recovery. Two retirees with identical 30-year average returns can have radically different outcomes if their bad years cluster differently. This is why the safe rate is a probability, not a guarantee.
3. Treating 4% as guaranteed. The Trinity 95% success rate at 4% means five out of 100 historical 30-year periods ended in portfolio depletion. Morningstar uses a stricter 90% probability target for its modern figure — even more honest. The 4 percent rule is not a floor. It’s the best historical estimate of a withdrawal rate that usually works.
4. Ignoring your horizon. The Trinity Study tested 30-year windows. A 65-year-old retiree with normal life expectancy fits that horizon. A 50-year-old planning a 45-year retirement doesn’t. Early retirees in the FIRE movement typically use 3.0-3.5% to account for the longer drawdown window. If you’re planning for 40+ years, 4% is too aggressive — drop the rate, raise the multiplier.
Going deeper
Three follow-up decisions matter most once you have your portfolio number:
- Account type. Roth withdrawals are tax-free in retirement; Traditional withdrawals are taxed as ordinary income. The breakeven math is in our Roth vs Traditional IRA breakdown.
- The compound growth that gets you to the number. See our compound interest explainer for what saving toward 25× looks like across 30 years.
- Keeping costs low. A 0.5% expense ratio compounds against you for decades — our ETF expense ratios piece shows the damage. The 4 percent rule assumes you keep returns; fees erode them.
The number itself is the easy part. The harder part is staying invested through the years when the rule looks like it’s about to break — those are the windows when it earns its keep.
Get early access to Orbit
Orbit is Luna3.ai’s AI-augmented research engine. 12 algorithmic signals + a gradient-boosted ML model + an agentic LLM that reads each top pick’s filings and writes a daily thesis with conviction score and catalyst proximity. Three regimes, three playbooks — growth in expansion, defensives in late-cycle, recovery plays at panic bottoms. The 3 in Luna3.ai.
No spam. Unsubscribe any time.
No comments yet. Be the first to share your thoughts!