
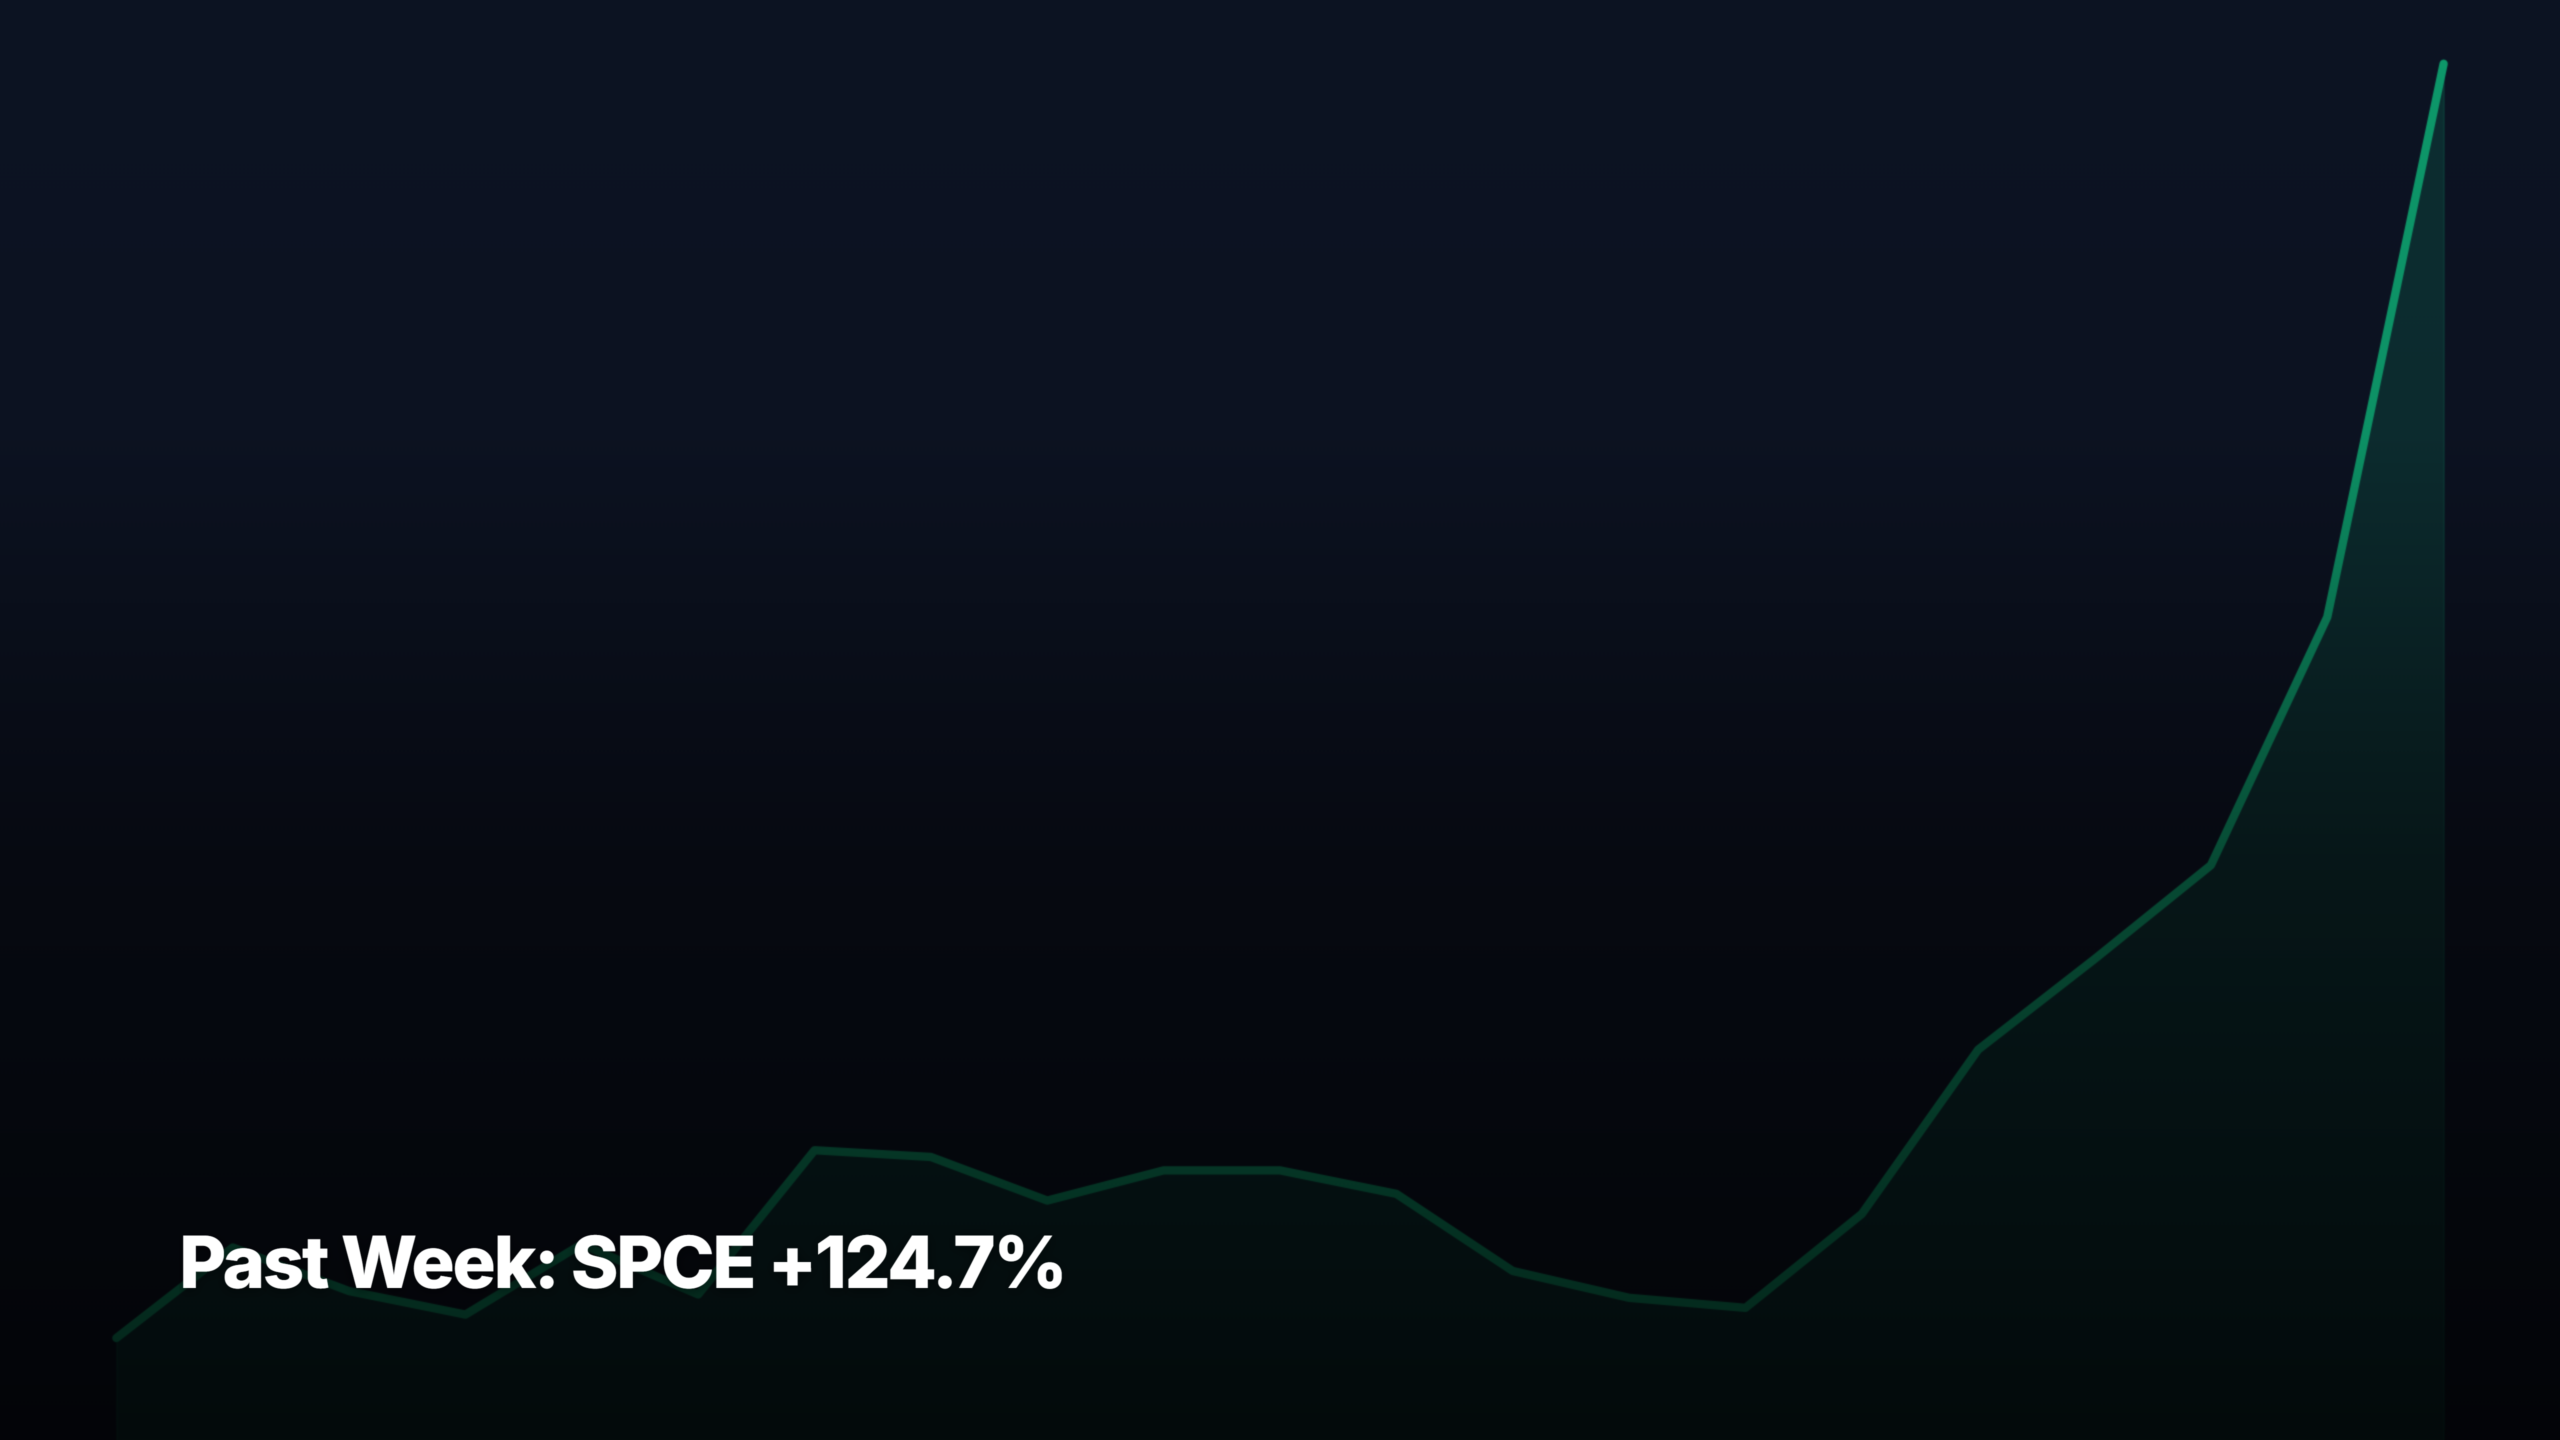
- SPCE +124.7% was the biggest gainer across all cap tiers over the past week through May 29, 2026.
- Top gainer: SPCE +124.7% (small-cap). Top decliner: ZS -18.3%.
- Return spread between the biggest gainer and biggest loser across all tiers was 143.0 percentage points — wide dispersion.
These are the top stock movers for the past week through May 29, 2026, broken down by market-cap tier. SPCE +124.7% was the single biggest move across all four tiers. For each tier, the top 3 gainers and top 3 decliners are listed with a plain-English catalyst note and a pattern-recognition read — whether the move looks like a clean breakout, momentum continuation, mean-reversion bounce, or extended run with reset risk.
Universe: ~145 curated US common stocks (NYSE + Nasdaq, ≥$300M market cap, ≥$1M average daily dollar volume). Cap tier reflects current market cap, not historical.
Mega-cap leaders (above $200B market cap)
Top gainers — past week
1. ↑ ORCL +18.98%
$225.78 · avg $4,253M/day · Mega-cap
Why: Oracle ripped higher as the AI infrastructure trade re-accelerated, with investors rewarding the cloud database giant alongside Snowflake and ServiceNow on renewed enthusiasm for enterprise AI spending. Multi-month momentum coverage and bullish valuation reassessments added fuel, signaling the market is treating Oracle as a credible second-tier hyperscaler beneficiary rather than a legacy software name.
Pattern: Extended momentum continuation — the move sits on top of an already-mature multi-month uptrend rather than breaking a fresh base. A near-19% week without a clear single catalyst raises reset potential; watch for a high-volume reversal day as a tell.
2. ↑ AMD +14.79%
$516.10 · avg $15,367M/day · Mega-cap
Why: AMD rallied into Computex 2026 in Taiwan, where the world’s biggest chip CEOs converge and product roadmaps get refreshed. Investor positioning ahead of the event, combined with renewed AI-trade enthusiasm and cryptic Nvidia teases lifting the whole accelerator complex, drove buying. Read-throughs from Oracle and Snowflake’s AI capex signals reinforced demand expectations for AMD’s MI accelerator line.
Pattern: Clean breakout from a multi-week consolidation on heavy dollar volume — $15B/day is institutional flow, not retail chase. Move looks pre-event positioning, so reset risk hinges on whether Computex delivers concrete product news or sells the news.
3. ↑ TMO +9.60%
$492.51 · avg $1,325M/day · Mega-cap
Why: Thermo Fisher caught a sharp single-day surge of nearly 7% inside the week with no clear company-specific catalyst — most likely a defensive rotation bid as investors looked for non-AI exposure with steady cash flows. Life sciences tools have lagged the broader market all year, so even modest sentiment improvement can drive outsized snapbacks in undervalued names.
Pattern: Mean-reversion bounce off prolonged underperformance — the chart looks more like a relief rally than a trend change. Without follow-through buying or a fundamental catalyst, this move risks fading back into the prior trading range.
Top decliners — past week
1. ↓ COST -8.96%
$956.32 · avg $3,185M/day · Mega-cap
Why: Costco slid through the $1,000 level as profit-taking hit one of the market’s most extended large-cap winners. Tariff refund headlines and broader concerns about consumer discretionary spending pressured the stock, while a rotation into beaten-down tech (Dell up 33% on the week) pulled capital away from defensive retail leaders. No earnings-related catalyst, just sentiment unwinding.
Pattern: Distribution top forming — a high-flying name breaking a key round-number support on a near-9% weekly drop is a classic profit-taking signature. Watch the next bounce attempt; failure to reclaim $1,000 would confirm trend damage.
2. ↓ XOM -6.46%
$145.26 · avg $2,009M/day · Mega-cap
Why: Exxon fell with the broader energy complex as crude prices weakened, with sector-wide selling pressure noted in afternoon trading. The Middle East peace optimism that’s lifted equities elsewhere directly hurts oil — fewer geopolitical risk premiums get priced into crude. Rotation out of defensive yield names into growth-and-AI further weighed on the integrated majors.
Pattern: Trending decline within an established downtrend — energy has been the weakest S&P sector for weeks. No sign of a reversal pattern; a clean break of the prior swing low would extend the move rather than reset it.
3. ↓ WMT -4.61%
$115.75 · avg $3,405M/day · Mega-cap
Why: Walmart pulled back modestly with no major company-specific catalyst — most plausibly defensive-staples rotation outflow as the AI trade reasserted dominance. The Teladoc partnership and supplier-network expansion are incrementally positive but didn’t move the needle against capital flowing into higher-beta tech. Bond-versus-stocks coverage suggests some investors trimmed yield-proxy equities.
Pattern: Shallow pullback within an established uptrend — a 4.6% weekly drop on no real news looks like normal consolidation in a name that’s been a steady grinder. No reset signal; would need a break below the 50-day moving average to change the read.
Large-cap leaders ($10B to $200B market cap)
Top gainers — past week
1. ↑ SNOW +54.37%
$255.55 · avg $4,034M/day · Large-cap
Why: Snowflake exploded 54% as the AI data infrastructure trade reignited, with investors aggressively repositioning into pure-play AI beneficiaries alongside Oracle and ServiceNow. The week’s narrative shift treats Snowflake as essential picks-and-shovels infrastructure for enterprise AI workloads, and short-covering likely amplified the move given the stock had been heavily shorted into the rally.
Pattern: Explosive breakout from a deep multi-quarter base — the magnitude and dollar volume suggest a real institutional positioning shift, not just a squeeze. Extended in the very short term; first pullback to the breakout zone would be a textbook test of follow-through buyers.
2. ↑ F +27.58%
$17.44 · avg $1,739M/day · Large-cap
Why: Ford surged on a fresh strategic narrative — the automaker’s push into stationary energy storage gave it an AI-data-center adjacent story investors are willing to pay up for. After a month where it rallied 43%, the energy-storage angle added new bull thesis fuel, and short interest in the legacy auto name created squeeze dynamics as catalysts kept landing.
Pattern: Extended momentum breakout — a low-priced legacy stock running 27% in a week after already running 43% in a month is late-cycle chase behavior. Reset risk is elevated; the move needs a real cash-flow story to hold or it fades like prior auto squeezes.
3. ↑ NOW +24.76%
$124.37 · avg $4,057M/day · Large-cap
Why: ServiceNow rode the same AI infrastructure wave as Oracle and Snowflake, with investors treating workflow automation as another picks-and-shovels AI play. Cloud automation coverage framing the stock as a ‘valuation reset steal’ attracted buyers, and the sector-wide enterprise software rally lifted the entire group. No company-specific catalyst beyond sentiment rotation back into AI-adjacent SaaS leaders.
Pattern: Clean recovery rally off a prior selloff base — the move recaptures meaningful technical levels and looks like trend repair rather than a fresh breakout. Less extended than SNOW or ORCL; follow-through above pre-selloff highs would confirm the reset is over.
Top decliners — past week
1. ↓ ZS -18.29%
$139.73 · avg $2,063M/day · Large-cap
Why: Zscaler dropped 18% in a brutal cybersecurity-specific selloff, named explicitly among the week’s biggest losers. Most plausibly an earnings or guidance disappointment given the magnitude and dollar volume — single-day drops of this size in a large-cap SaaS name typically tie to a quarterly print. The high-growth-tech context suggests valuation concerns also amplified the move.
Pattern: Distribution top broken — an 18% weekly drop on $2B daily volume is a clear trend reversal signal, not a routine pullback. Pattern suggests further downside unless a fast V-bottom reclaim emerges; mean-reversion buyers should wait for stabilization.
2. ↓ MDT -5.55%
$73.81 · avg $900M/day · Large-cap
Why: Medtronic slid into its upcoming Q4 earnings print as investors trimmed positions ahead of the report. Pre-earnings de-risking is the most plausible driver given no fresh negative catalyst — analysts were publicly modeling Q4 metrics, suggesting buy-side cautioning into the print. Competitive coverage versus Abbott and Boston Scientific added relative-performance pressure.
Pattern: Pre-event derisking pullback within a longer-term sideways range — the chart structure doesn’t signal a major trend break yet. Earnings outcome resolves the read; a beat-and-raise would likely produce a sharp snapback to the prior range high.
3. ↓ SBUX -4.77%
$99.16 · avg $843M/day · Large-cap
Why: Starbucks faced a triple-headwind week: a significant sales drop in South Korea, the quiet retirement of its AI inventory agent after operational failures, and ongoing concerns about international growth markets. None individually catastrophic, but the cluster reinforces the bear case that Starbucks is losing both operational efficiency gains and international momentum simultaneously.
Pattern: Trending decline continuation — the stock has been weak for months and this week extends the pattern without showing any reversal signal. No reset potential visible; needs a clear catalyst (margin recovery, China stabilization) to break the downtrend.
Mid-cap leaders ($2B to $10B market cap)
Top gainers — past week
1. ↑ HOOD +24.21%
$94.30 · avg $2,940M/day · Mid-cap
Why: Robinhood surged on diversification narrative wins — the headline that the rally wasn’t driven by Bitcoin signals investors are rewarding the platform’s expansion beyond crypto into cannabis trading and traditional brokerage market share. The decoupling from Bitcoin is itself bullish, removing a single-factor dependency that historically capped the stock’s valuation multiple.
Pattern: Clean breakout to new local highs with strong volume confirmation — the diversification narrative gives the move a fundamental anchor rather than pure momentum. Less extended than the small-cap movers; healthy continuation pattern with room to run if the cannabis catalyst materializes.
2. ↑ GTLB +21.19%
$31.05 · avg $123M/day · Mid-cap
Why: GitLab caught the AI software rally tailwind ahead of its Q1 earnings report, with investors positioning for a potential beat tied to AI-coding features. Inclusion in the Snowflake-Oracle-ServiceNow AI rally coverage lifted sentiment, and the pre-earnings setup attracted speculative buyers betting GitLab’s DevOps platform benefits from the same enterprise AI spending wave.
Pattern: Pre-earnings momentum surge from a depressed base — the move looks like positioning rather than fundamentals confirmation. Reset risk is high if earnings disappoint; binary event will resolve the trend direction.
3. ↑ ASAN +21.07%
$7.70 · avg $63M/day · Mid-cap
Why: Asana rallied on Q1 earnings highlights showing strong revenue growth and guidance upgrades driven by AI product adoption and workflow automation. The narrative pivot from ‘battered by the AI boom’ to ‘agents working alongside humans’ resonated with investors looking for AI winners that aren’t priced for perfection. Concrete enterprise AI traction validated the turnaround thesis.
Pattern: Earnings-driven gap and momentum follow-through from deeply oversold levels — classic post-capitulation reversal pattern. The low absolute price ($7.70) means small dollar moves create large percent gains; constructive but watch for profit-taking on first failed extension.
Top decliners — past week
1. ↓ FCEL -17.89%
$21.66 · avg $237M/day · Mid-cap
Why: FuelCell Energy fell as the clean energy hydrogen complex broke down — Plug Power held up while FuelCell and Bloom Energy sold off, suggesting capital rotation within the group rather than blanket sector selling. The contrast coverage versus Bloom Energy framing implies investors picked winners and dumped laggards inside the fuel cell category.
Pattern: Trending decline with relative weakness signal — the divergence from Plug Power’s strength is the key tell that this is a name-specific bear case, not just sector beta. No reset signal; needs a fundamental catalyst to break the relative-weakness pattern.
2. ↓ ZG -5.07%
$35.36 · avg $39M/day · Mid-cap
Why: Zillow dropped as the company itself painted a grim housing market outlook, with mortgage rates inching higher reinforcing the affordability squeeze. The headline framing ‘Zillow just painted a grim outlook’ from a company that profits from transaction volume is particularly bearish — the platform’s own data is forecasting reduced activity, which directly hits its revenue model.
Pattern: Shallow trending decline within an established range — a 5% weekly drop on light volume doesn’t signal capitulation, more steady distribution. Reset would need a clear rate-cut catalyst or housing inventory shift; absent that, the slow grind lower likely continues.
3. ↓ DKNG -3.58%
$24.49 · avg $391M/day · Mid-cap
Why: DraftKings modestly declined as fund-flow coverage suggested institutional money is avoiding both FanDuel and DraftKings for alternative sports betting plays. No major negative catalyst — California’s proposed billionaire tax and Massachusetts/Boston positioning are sector-adjacent noise. The pullback looks more like sentiment cooling than a fundamental break.
Pattern: Routine consolidation within a broader trading range — under 4% weekly drop on average volume is normal noise, not a trend signal. No reset implications; stock is in a chop pattern waiting for a fundamental catalyst.
Small-cap leaders ($300M to $2B market cap)
Top gainers — past week
1. ↑ SPCE +124.73%
$6.18 · avg $329M/day · Small-cap
Why: Virgin Galactic more than doubled on a flight-testing restart announcement combined with SpaceX IPO speculation lifting the entire commercial space sector. Adding momentum-pick coverage and the rebound from prior selloffs created a perfect speculative storm. The Blue Origin explosion that hurt AST SpaceMobile and Planet Labs paradoxically benefited Virgin Galactic as risk-tolerant capital rotated into the surviving public space play.
Pattern: Explosive parabolic squeeze from a beaten-down small-cap base — 125% in a week is pure speculative chase, not fundamental repricing. Reset potential is extremely high; these moves typically retrace 40-60% within weeks. Trim-and-flip territory, not buy-and-hold.
2. ↑ ONDS +44.01%
$13.22 · avg $1,500M/day · Small-cap
Why: Ondas surged on a Q2 order update that retail investors framed as an ‘order story the market can’t ignore,’ combined with the Omnisys acquisition adding scale to its drone-tech business. The Trump administration drone policy tailwind keeps lifting the entire small-cap defense-drone cohort (UMAC, KTOS, RCAT), with ONDS standing out on company-specific order momentum.
Pattern: Strong breakout backed by real $1.5B daily dollar volume — that’s institutional participation, not just retail chase. Less extended than SPCE; the order-story fundamentals give the move more durability if subsequent quarters confirm the trajectory.
3. ↑ KEEL +22.41%
$5.68 · avg $229M/day · Small-cap
Why: Keel Infrastructure rallied with the bitcoin miner cohort as AI infrastructure spending coverage highlighted miners as overlooked compute-real-estate plays. The thematic pitch — miners crushing BTC returns by pivoting to AI data center capacity — caught investor attention even as a business-services framing noted KEEL had been a relative laggard year-to-date.
Pattern: Momentum breakout on thematic flow within a multi-week base — 22% on healthy volume suggests genuine accumulation, not just a one-day pop. Constructive setup if the BTC-miner-to-AI-infrastructure narrative keeps drawing capital; first pullback is the entry tell.
Top decliners — past week
1. ↓ GME -5.82%
$21.18 · avg $107M/day · Small-cap
Why: GameStop dipped despite raising its eBay stake above 7% — Ryan Cohen’s ongoing pressure campaign on eBay isn’t translating to GME shareholder enthusiasm. Most plausibly capital allocation skepticism: investors questioning whether deploying treasury cash into eBay equity is the best use of GME’s balance sheet versus operational turnaround spending or returns.
Pattern: Modest pullback within a low-volatility range — 6% weekly drop on $107M volume is unremarkable for GME’s historical volatility. No major trend break signal; meme-stock dynamics make pattern-reading less reliable here than fundamental names.
2. ↓ GLSI -3.73%
$26.17 · avg $4M/day · Small-cap
Why: Greenlight Biosciences saw a minor drift lower with no clear catalyst — no headlines to pin the move on suggests routine profit-taking after a prior run or sector-wide small-cap biotech weakness. The low $4M daily dollar volume means even small selling pressure produces visible price moves; no fundamental signal in the action.
Pattern: Shallow drift within a tight range — 3.7% on $4M daily volume is noise-level price action. No pattern signal worth acting on; stock is in low-conviction holding territory awaiting clinical or partnership catalyst.
3. ↓ BLNK -0.48%
$0.83 · avg $2M/day · Small-cap
Why: Blink Charging traded essentially flat on no fresh news — at $0.83 with just $2M daily dollar volume, the stock is in delisting-risk territory where institutional capital has largely exited. The flat tape reflects an absence of both buyers and sellers, not active positioning; any meaningful move would require a strategic catalyst (capital raise, going-private bid, partnership).
Pattern: Bottoming drift at distressed levels — flat-line action at sub-$1 prices typically resolves to either delisting or sharp speculative bounce. No pattern read possible at this volume; treat as binary event-driven rather than technically tradable.
What the past week cohort tells us
Small-caps dominated the leaderboard this week, with SPCE (+125%), ONDS (+44%), and KEEL (+22%) producing returns that dwarfed mega-cap winners — a clear risk-on signature where speculative capital is reaching for asymmetric payoffs rather than crowding into established compounders. The AI infrastructure trade reasserted itself across cap tiers, with ORCL, AMD, SNOW, NOW, and GTLB all riding the same enterprise-AI-spending narrative, suggesting investors aren’t done repricing picks-and-shovels names. Laggard pattern is informative: defensive staples (COST, WMT), energy (XOM), and housing-adjacent (ZG) all weakened, while cybersecurity (ZS) saw a name-specific blowup — capital is leaving safety and yield to chase growth and thematic stories. Return dispersion is exceptionally wide (-18% to +125%), the classic signature of a momentum-driven tape where stock-picking dominates index returns. The forward-looking observation: when small-cap speculative names lead by this margin while defensives lag, late-cycle chase dynamics are typically near peak — the next 2-4 weeks often see either a sharp small-cap reversal or a broadening rally as mega-caps catch a relative bid; watch for which scenario plays out.
Bottom line
The top stock movers recap covers every US market-cap tier from mega ($200B+) to small ($300M-$2B). The Past Week view shows sustained leadership and sector rotation — complementary to the daily session recap (single-session moves, Tue-Sat morning Melbourne time).
Get early access to Orbit
Orbit is Luna3.ai’s AI-augmented research engine. 12 algorithmic signals + a gradient-boosted ML model + an agentic LLM that reads each top pick’s filings and writes a daily thesis with conviction score and catalyst proximity. Three regimes, three playbooks — growth in expansion, defensives in late-cycle, recovery plays at panic bottoms. The 3 in Luna3.ai.
No spam. Unsubscribe any time.
No comments yet. Be the first to share your thoughts!