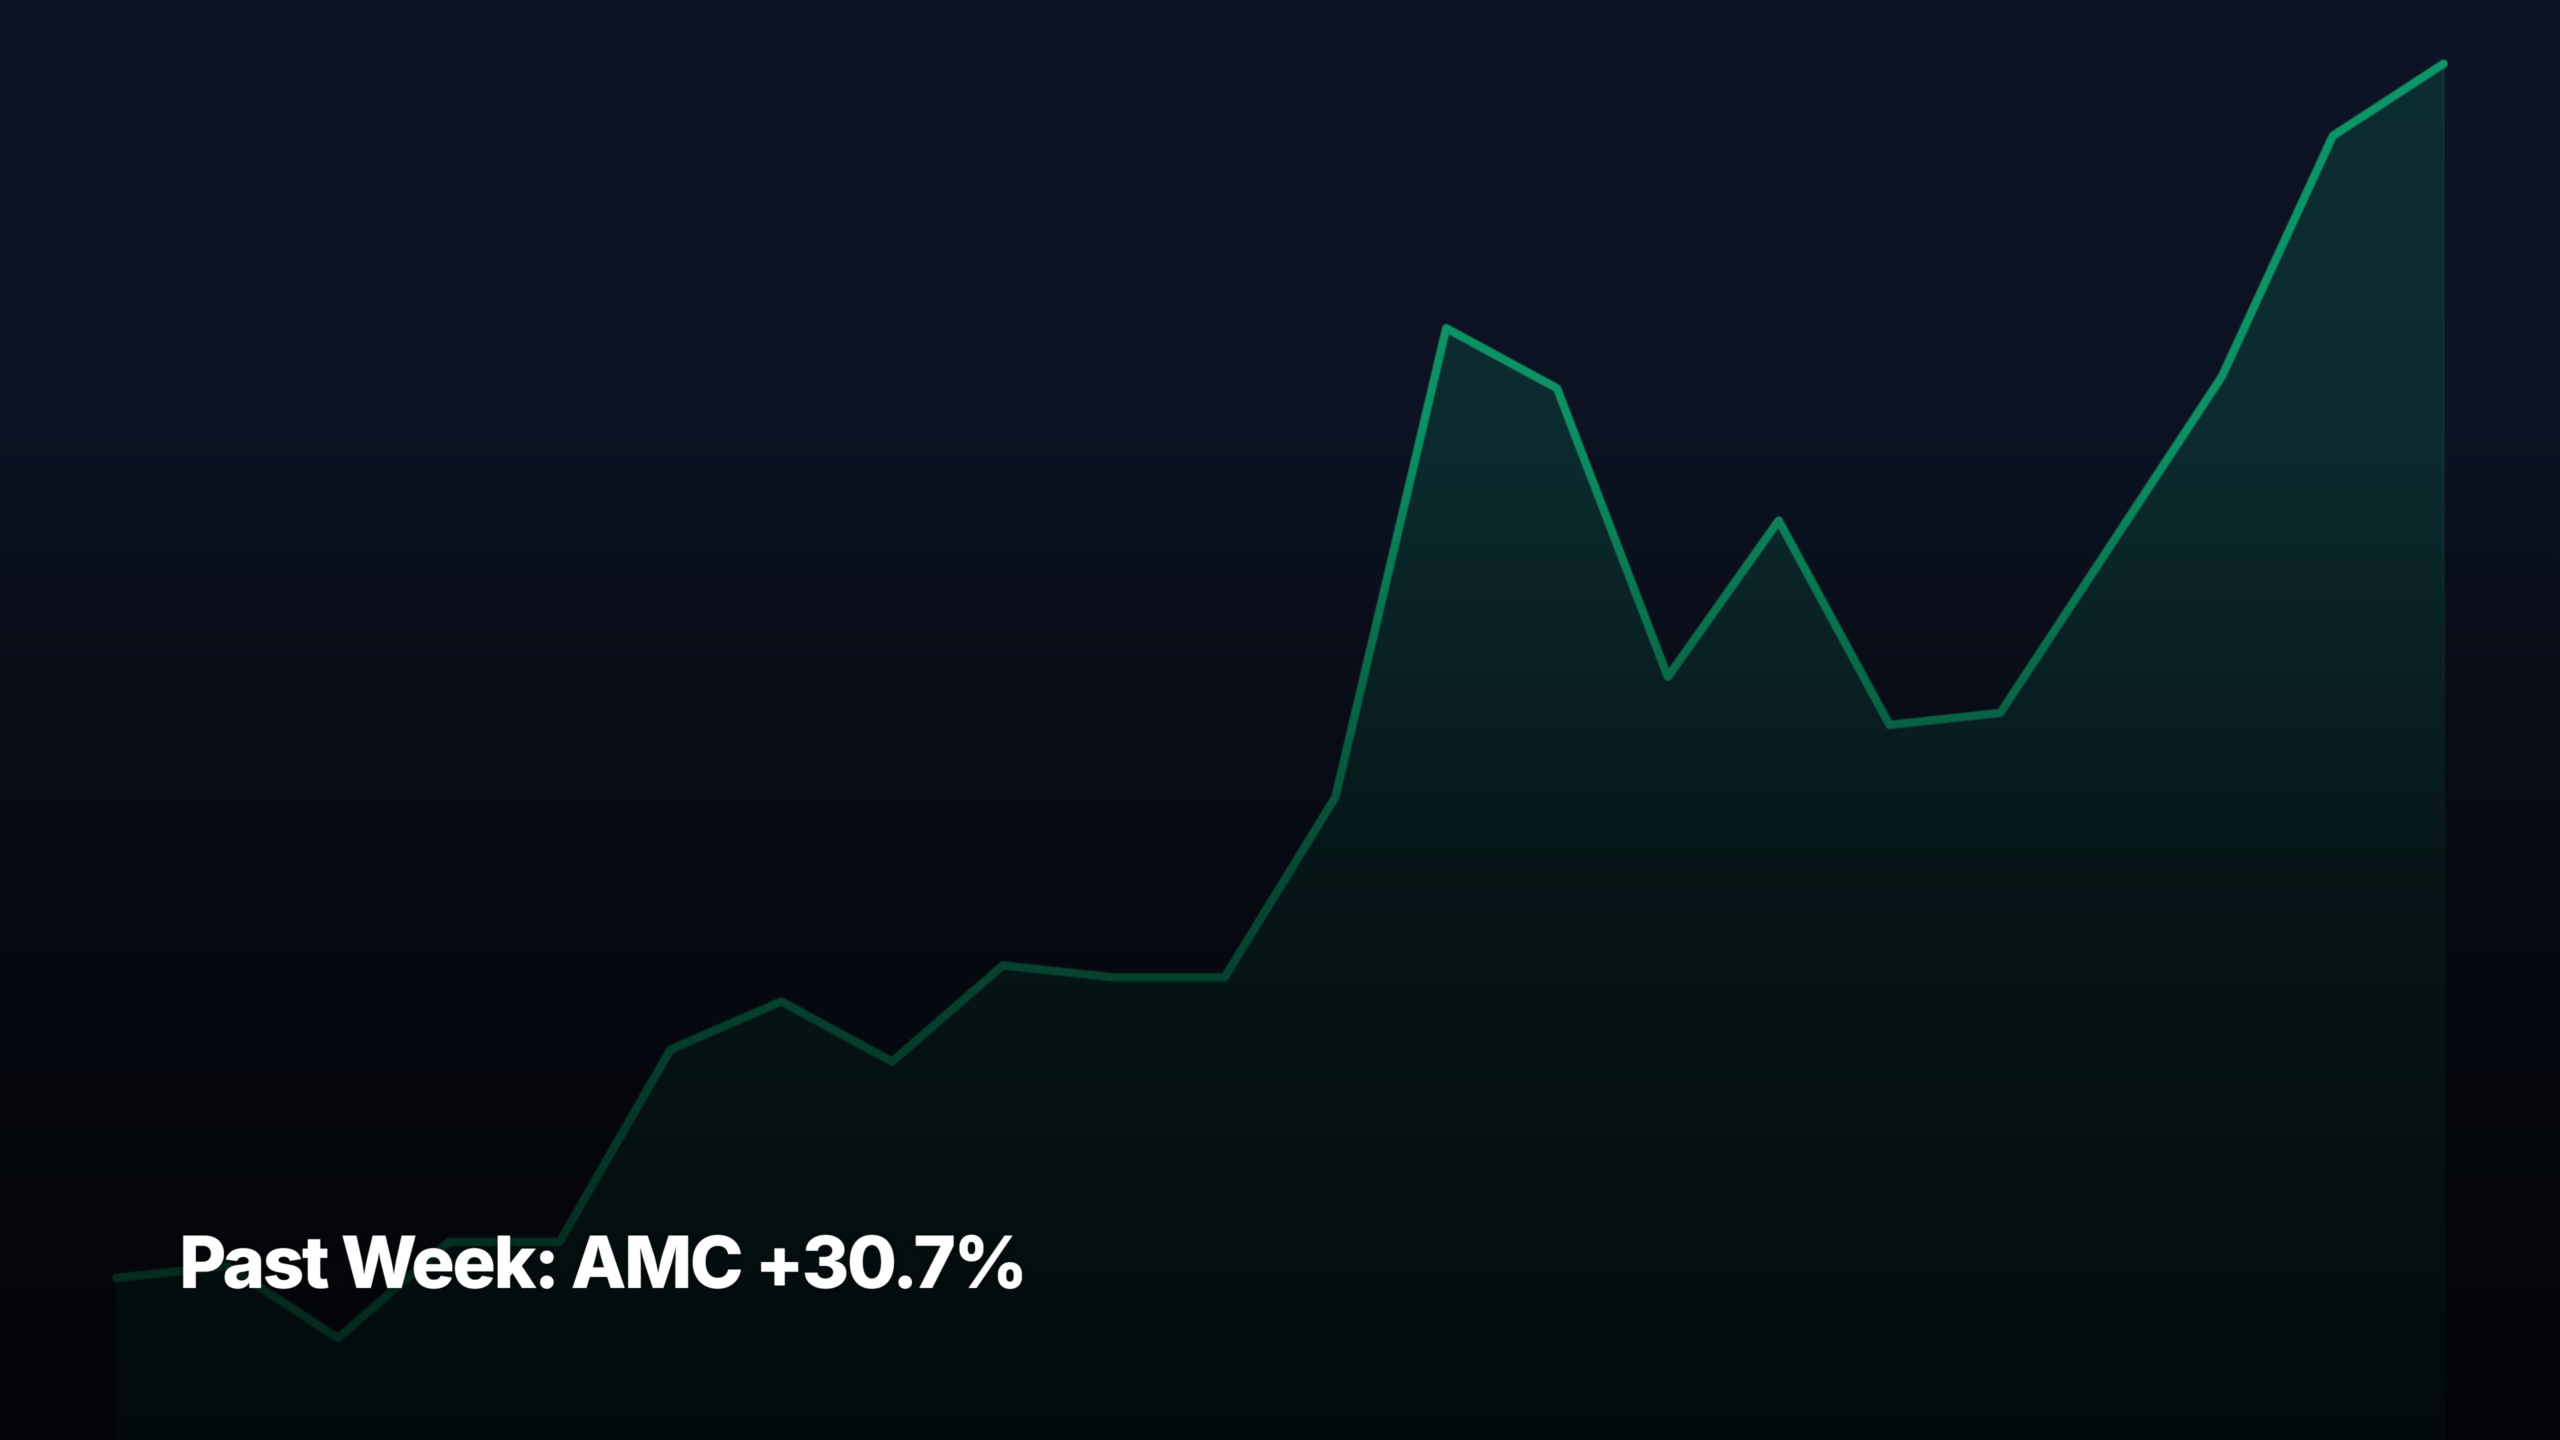
- AMC +30.7% was the biggest gainer across all cap tiers over the past week through June 12, 2026.
- Top gainer: AMC +30.7% (mid-cap). Top decliner: ADBE -18.9%.
- Return spread between the biggest gainer and biggest loser across all tiers was 49.6 percentage points — wide dispersion.
These are the top stock movers for the past week through June 12, 2026, broken down by market-cap tier. AMC +30.7% was the single biggest move across all four tiers. For each tier, the top 3 gainers and top 3 decliners are listed with a plain-English catalyst note and a pattern-recognition read — whether the move looks like a clean breakout, momentum continuation, mean-reversion bounce, or extended run with reset risk.
Universe: ~145 curated US common stocks (NYSE + Nasdaq, ≥$300M market cap, ≥$1M average daily dollar volume). Cap tier reflects current market cap, not historical.
Mega-cap leaders (above $200B market cap)
Top gainers — past week
1. ↑ AMD +9.69%
$511.57 · avg $14,702M/day · Mega-cap
Why: AMD pushed nearly 10% higher as the AI-chip trade rotated toward the second-place name. Friday’s ~5% session followed renewed enthusiasm around AMD’s MI-series roadmap and customer wins, with Qualcomm and other semis trading in sympathy. The move is more about positioning catch-up versus Nvidia than a single company-specific catalyst.
Pattern: Looks like a clean continuation push from a multi-week base — momentum is strong but not yet vertical. Volume confirmation supports trend. No extension warning yet, though a pause near round-number $500 is plausible before the next leg.
2. ↑ HD +5.67%
$328.39 · avg $1,385M/day · Mega-cap
Why: Home Depot caught a defensive bid as money rotated out of high-multiple software. UBS commentary on AI uplift in retail operations gave analysts a forward hook, and the pro-customer segment narrative resurfaced. No earnings catalyst — this is a rotation trade into cash-flow-stable mega-cap consumer names while tech wobbles.
Pattern: Mean-reversion bounce off the lower end of a multi-month range. Move is orderly with no volume spike, suggesting accumulation rather than chase. Room to run toward range highs before any extension concern.
3. ↑ BAC +4.07%
$56.02 · avg $1,766M/day · Mega-cap
Why: Bank of America rode the broader risk-on tone tied to easing US-Iran tensions and a stronger yield environment for net interest margins. Sympathy bid alongside other large banks — no BAC-specific catalyst beyond the firm’s own bullish Intel call drawing attention to the franchise. Steady accumulation, not a news-driven pop.
Pattern: Quiet grind higher off a base — textbook large-bank trending behavior. Volume is unremarkable, which is bullish for sustainability. No extension signs; the move is well within normal weekly drift.
Top decliners — past week
1. ↓ ADBE -18.86%
$204.02 · avg $2,590M/day · Mega-cap
Why: Adobe collapsed nearly 19% after a CFO exit triggered analyst downgrades and reignited the generative-AI competitive-threat narrative. The market is pricing real risk that Firefly and Creative Cloud lose share to OpenAI and lower-cost AI design tools. This is a fundamental re-rating, not a positioning flush.
Pattern: Distribution top breakdown — gap-down with heavy volume through prior support. Classic broken-leader pattern. No reset signal yet; bounces likely get sold until a new base forms. Avoid catching the knife.
2. ↓ ORCL -13.83%
$184.13 · avg $7,087M/day · Mega-cap
Why: Oracle gave back a chunk of its recent AI-infrastructure rally as investors questioned the sustainability of OCI growth assumptions and capex burn. No single negative catalyst — more a profit-taking unwind after the stock got extended into the prior earnings move. Sector rotation out of AI-adjacent infrastructure names amplified the drawdown.
Pattern: Sharp pullback from extended highs — looks like a mean-reversion flush rather than a trend break. The prior uptrend is still intact on longer timeframes. Watch for stabilization near the 50-day before declaring reset.
3. ↓ MSFT -6.22%
$390.74 · avg $14,487M/day · Mega-cap
Why: Microsoft slipped over 6% on no company-specific news — softer than the broader tape as megacap AI leaders saw profit-taking ahead of summer. Concerns about capex intensity and the durability of Copilot monetization resurfaced. Part of a broader rotation out of mega-cap tech and into cyclicals and financials.
Pattern: Orderly pullback from an extended position — not a breakdown. Volume is heavy but not climactic. Pattern suggests a normal trend pause rather than reversal; key support sits a few percent lower.
Large-cap leaders ($10B to $200B market cap)
Top gainers — past week
1. ↑ INTC +25.61%
$124.57 · avg $16,984M/day · Large-cap
Why: Intel ripped 25% on a Bank of America price-target reset and renewed optimism around the foundry strategy and government CHIPS Act support. Short covering amplified the move as the stock had been heavily bet against. This is a sentiment-shift week, not a fundamentals-changed week — but flows matter.
Pattern: Explosive breakout from a long basing range on heavy volume — classic short-squeeze pattern fused with a real reversal setup. Extended near-term; reset potential into the 5-10% retracement zone is high, but the larger structure looks constructive.
2. ↑ ROKU +17.50%
$143.66 · avg $709M/day · Large-cap
Why: Roku surged on M&A chatter — reports suggesting the streaming platform could be in play drove a 20% Friday print. The takeout speculation is the entire story; no operating catalyst. Whether or not a deal materializes, the price reflects optionality investors hadn’t been paying for.
Pattern: News-driven gap-and-go from a multi-month base. Volume confirms institutional participation. If the M&A premise fades, expect a sharp give-back; if it firms up, $150+ stays in play. Headline-dependent regime.
3. ↑ IREN +9.97%
$59.77 · avg $2,612M/day · Large-cap
Why: IREN’s $1.6B Dell deal for Blackwell AI systems plus a 5.8 GW data-center buildout announcement reframed the company from bitcoin miner to AI-infrastructure play. Adding a new Australian data center reinforced the pivot. This is a genuine narrative change with hard contract numbers attached.
Pattern: Continuation breakout from an established uptrend — momentum is intact but the move into the $60s puts the stock at extended levels relative to its 50-day. Healthy if it consolidates here; vulnerable to a 10-15% flush if AI-adjacent enthusiasm cools.
Top decliners — past week
1. ↓ CRM -10.42%
$165.89 · avg $2,255M/day · Large-cap
Why: Salesforce caught contagion from the Adobe AI-disruption trade — if Firefly is vulnerable to generative AI, Slack and Service Cloud face similar questions. No CRM-specific catalyst, but the read-through to broader SaaS is real. Investors are reassessing what an AI-native competitive landscape does to legacy software multiples.
Pattern: Breakdown through key support on rising volume — looks like the start of distribution rather than a reset bounce candidate. Needs to reclaim $180 to neutralize the damage. Until then, rallies are likely sold.
2. ↓ NOW -9.16%
$102.15 · avg $2,756M/day · Large-cap
Why: ServiceNow declined in sympathy with the broader enterprise-software derating, despite analyst commentary on Now Assist demand strength. No specific catalyst — the sell-off reflects multiple compression across SaaS as AI-disruption narratives intensify around Adobe and Salesforce. Premium-multiple names get hit hardest in rotation moves.
Pattern: Pullback from extended highs — first real test of the uptrend in months. Looks like a healthy reset rather than a breakdown so far. Watch the 50-day for whether dip-buyers step in or the trend cracks.
3. ↓ SNAP -8.68%
$5.26 · avg $198M/day · Large-cap
Why: Snap drifted lower with no clear company catalyst — broader ad-tech rotation as investors debate Section 230 legal exposure for Meta and Google bled into smaller platforms. Reddit gaining international share also raised competitive worries. At $5 the stock trades on narrative rather than fundamentals.
Pattern: Continuation of a longer-running trending decline — no reset signal. Low absolute price means percentage moves overstate dollar moves. Pattern stays bearish until a multi-week base forms.
Mid-cap leaders ($2B to $10B market cap)
Top gainers — past week
1. ↑ AMC +30.73%
$2.34 · avg $87M/day · Mid-cap
Why: AMC jumped 30% after completing a $150M equity offering — counterintuitively bullish because it removes near-term dilution overhang and signals balance sheet flexibility. Meme-adjacent retail flows piled in. The summer box office calendar adds a real fundamental tailwind on top of the squeeze dynamics.
Pattern: Sharp low-base bounce on heavy volume — classic high-short-interest squeeze pattern. Extended near-term; expect a 15-25% give-back as the offering pop fades. Sustainability depends on box-office numbers, not the equity raise.
2. ↑ KSS +17.73%
$18.06 · avg $96M/day · Mid-cap
Why: Kohl’s surged with the broader department-store group as investors revisited deep-value retail names. Consumer-resilience reads and short-covering helped. No company-specific positive — earnings commentary remains mixed. This is a low-multiple deep-value rotation trade, not a turnaround confirmation.
Pattern: Sharp reflex bounce off depressed levels — looks like short-covering and mean reversion rather than a trend change. Needs follow-through volume to confirm. High give-back risk if the rotation reverses.
3. ↑ DKNG +16.33%
$29.00 · avg $534M/day · Mid-cap
Why: DraftKings caught a bid on World Cup-related betting volume expectations and broader consumer-discretionary rotation. The 2026 World Cup hosting in the US is finally close enough to matter for forward estimates. Clean momentum trade — sportsbook operators benefit from a rare multi-year structural catalyst.
Pattern: Clean breakout from a multi-week consolidation on rising volume. Momentum is constructive; trend looks early rather than extended. Room to run toward prior highs if sports-betting tailwinds hold.
Top decliners — past week
1. ↓ PLUG -14.29%
$2.76 · avg $148M/day · Mid-cap
Why: Plug Power slid on a valuation-check piece and broader clean-energy sector weakness as FuelCell Energy’s pipeline came under similar scrutiny. No fresh negative catalyst — just the ongoing question of whether revenue ever catches up to the capex story. Sub-$3 stocks trade on flows.
Pattern: Continuation lower within an established downtrend — no base-building yet. Pattern stays bearish; bounces are likely sold without a fundamental catalyst. Reset potential requires multi-week stabilization first.
2. ↓ GTLB -10.70%
$27.79 · avg $181M/day · Mid-cap
Why: GitLab declined despite launching Transcend AI-security capabilities and hiring a new CISO. The market is increasingly skeptical that mid-cap developer-tooling can defend against AI-coding disruption from larger platforms. Broader SaaS derating contagion from Adobe and Salesforce hit names like GitLab disproportionately.
Pattern: Breakdown through recent support on elevated volume. Mid-cap SaaS leadership eroding — pattern looks like distribution, not a reset bounce setup. Needs to hold $27 to avoid a deeper leg lower.
3. ↓ AKAM -10.59%
$133.50 · avg $578M/day · Mid-cap
Why: Akamai dropped sharply alongside Asana and Braze in a broader enterprise-software flush. The Microsoft cloud-security partnership announcement wasn’t enough to offset the rotation pressure on legacy infrastructure names. Investors continue questioning Akamai’s growth profile as CDN economics compress.
Pattern: Sharp breakdown from a range — looks like trend resumption lower rather than a one-off flush. Volume confirms institutional selling. Reset signal would require a multi-day base forming near the current low.
Small-cap leaders ($300M to $2B market cap)
Top gainers — past week
1. ↑ STUB +23.36%
$11.46 · avg $79M/day · Small-cap
Why: StubHub gained 23% with no recent headlines — likely a quiet flow-driven move as event-economy and live-entertainment names rotate higher into a strong summer concert and sports calendar. Small float and lighter coverage amplify percentage moves. Without a clear catalyst, the durability is questionable.
Pattern: Sharp move higher on a thin tape — pattern looks more like a flow squeeze than a structural breakout. Extended near-term; vulnerable to a give-back if the tape softens. Needs volume confirmation to be taken seriously.
2. ↑ MARA +14.29%
$14.08 · avg $514M/day · Small-cap
Why: MARA rallied on the Long Ridge deal and a broader AI-energy pivot story — bitcoin miners increasingly being repriced as power-and-data-center assets. The broader risk-on tone on US-Iran peace hopes amplified the move. The narrative shift from pure crypto leverage to AI-infrastructure host is the durable driver.
Pattern: Continuation move within an emerging uptrend — momentum looks early rather than extended. Volume supports the move. Watch for consolidation around $14 before the next attempt at $15-16 resistance.
3. ↑ CIFR +9.13%
$24.50 · avg $517M/day · Small-cap
Why: Cipher Mining got a Jefferies initiation that highlighted the miner-to-AI-host pivot — same playbook as IREN and MARA. The CoreWeave credit-rebound piece reinforced cheaper data-center funding as a tailwind. Crypto-stock-fund outperformance year-to-date keeps generalist flows engaged.
Pattern: Continuation higher from a multi-week base — clean technical setup. Momentum is constructive but the AI-energy cohort is getting crowded, raising correlated reset risk if sentiment shifts. Healthy structure for now.
Top decliners — past week
1. ↓ BLDP -14.23%
$4.22 · avg $39M/day · Small-cap
Why: Ballard Power dropped 14% with no recent headlines — caught in the broader hydrogen and fuel-cell sector flush alongside Plug Power. Skepticism around commercial-scale economics keeps pressuring the cohort. Low absolute price and thin liquidity amplify percentage moves on flow alone.
Pattern: Continuation of a long-running trending decline — no basing pattern yet. Pattern stays bearish on every timeframe. Reset signal would require multi-week stabilization plus a fundamental hydrogen catalyst.
2. ↓ ASTS -11.96%
$82.41 · avg $2,395M/day · Small-cap
Why: AST SpaceMobile fell 12% as the SpaceX direct-listing debut sucked capital and attention away from publicly traded space names. Investors rotated into the higher-profile name. The flush is positioning, not operations — AST’s satellite roadmap is unchanged, but the relative-value trade went the other way.
Pattern: Sharp pullback from extended highs — looks like a positioning flush rather than a trend break. Watch whether buyers reclaim $90 quickly; failure to do so would suggest the SpaceX overhang persists longer than a single week.
3. ↓ SPCE -10.73%
$3.91 · avg $363M/day · Small-cap
Why: Virgin Galactic dropped alongside the broader space cohort as SpaceX’s 27% IPO debut concentrated investor enthusiasm in one name. At sub-$4, SPCE has no fundamental support — it trades on retail sentiment toward the broader space theme, and that sentiment just rotated to a different ticker.
Pattern: Continuation of a long downtrend — no reset signal. The SpaceX listing creates a structurally tougher backdrop for sub-scale space stocks. Pattern stays bearish unless an idiosyncratic catalyst appears.
What the past week cohort tells us
The week’s strongest absolute returns clustered in mid- and large-cap names with idiosyncratic stories — AMC’s offering relief (+31%), Intel’s sentiment reset (+26%), and StubHub’s flow squeeze (+23%) all dwarfed mega-cap leaders. That dispersion pattern signals a tape driven by specific catalysts and short-covering rather than broad index strength. The leadership read is mixed: mega-cap tech mostly weakened (MSFT, ORCL, ADBE all double-digit decliners), while financials (BAC), consumer-defensive (HD), and deep-value retail (KSS) caught rotation bids — a quiet shift away from premium-multiple software toward cash-flow-stable cyclicals. The AI-disruption narrative around Adobe and Salesforce is the week’s most important undercurrent, threatening to rerate the entire enterprise SaaS cohort lower. Meanwhile, the bitcoin-miner-to-AI-host pivot (IREN, MARA, CIFR) shows fresh capital chasing a genuine narrative shift. Return dispersion is unusually wide — a sign of regime change rather than steady trend. The forward observation: if SaaS multiple compression continues while AI-energy infrastructure plays hold, the second half could see a meaningful shift in which names lead the next leg.
Bottom line
The top stock movers recap covers every US market-cap tier from mega ($200B+) to small ($300M-$2B). The Past Week view shows sustained leadership and sector rotation — complementary to the daily session recap (single-session moves, Tue-Sat morning Melbourne time).
Get early access to Orbit
Orbit is Luna3.ai’s AI-augmented research engine. 12 algorithmic signals + a gradient-boosted ML model + an agentic LLM that reads each top pick’s filings and writes a daily thesis with conviction score and catalyst proximity. Three regimes, three playbooks — growth in expansion, defensives in late-cycle, recovery plays at panic bottoms. The 3 in Luna3.ai.
No spam. Unsubscribe any time.
No comments yet. Be the first to share your thoughts!