
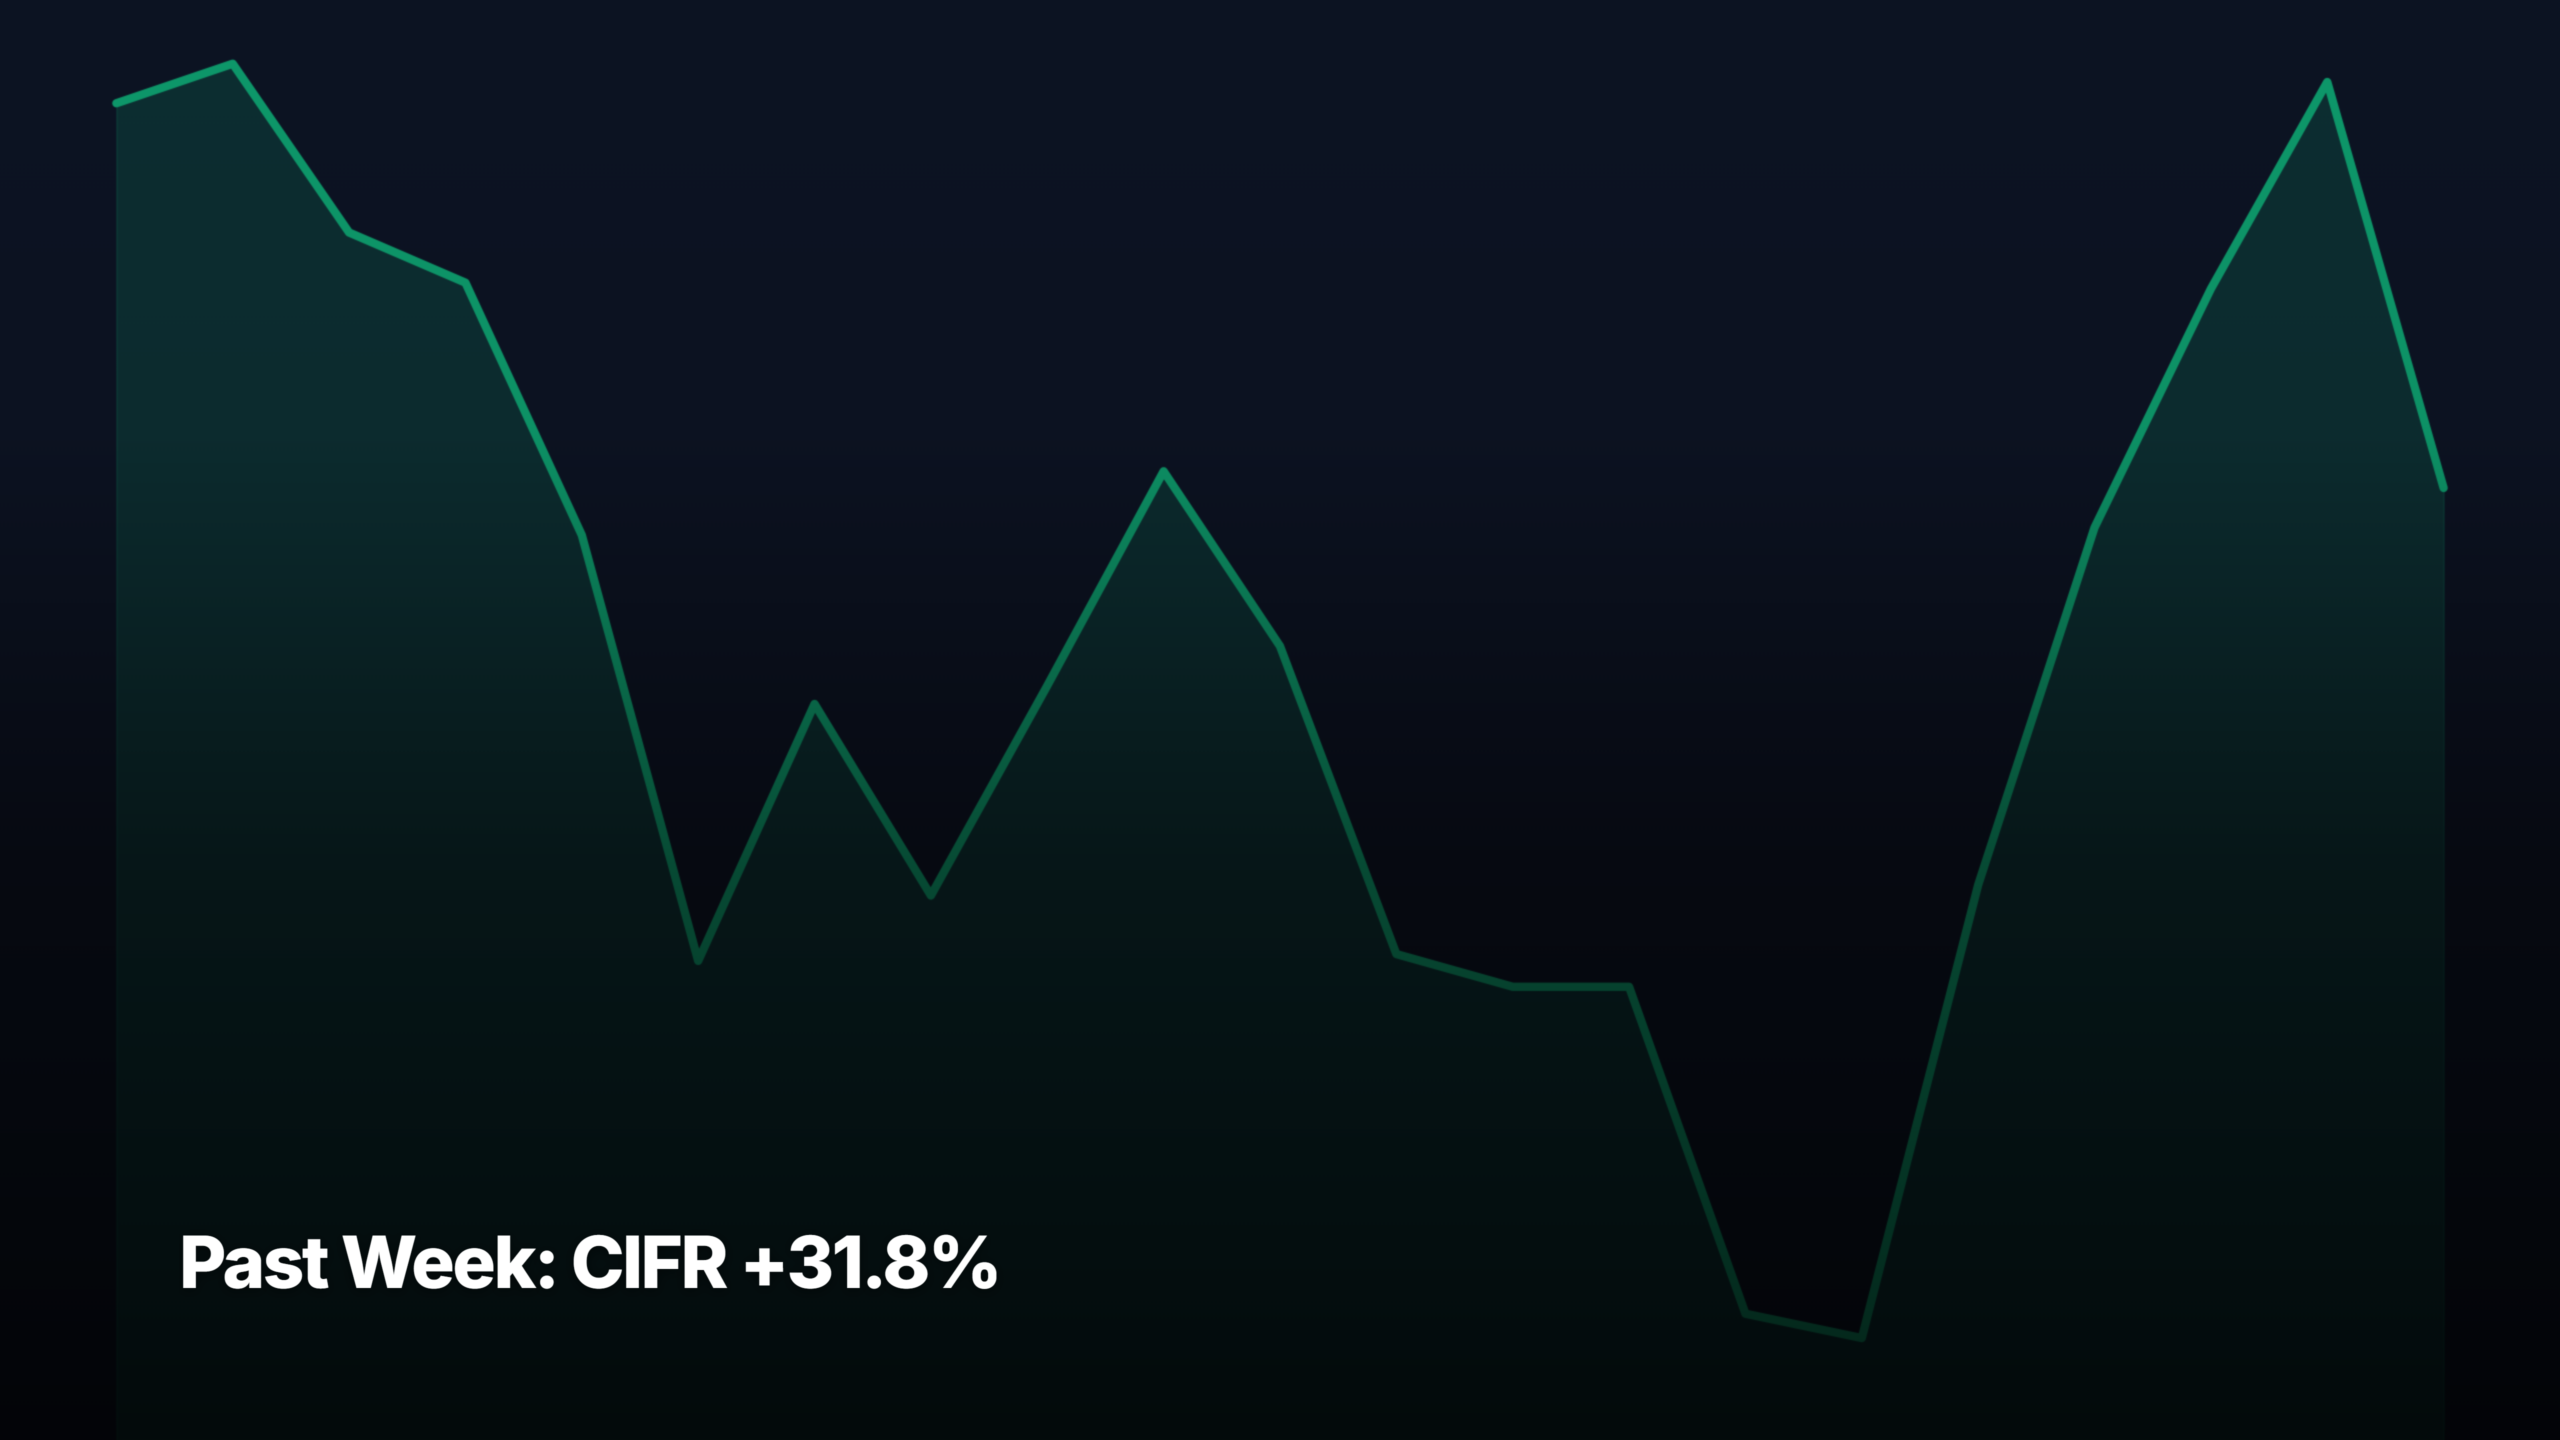
- CIFR +31.8% was the biggest gainer across all cap tiers over the past week through July 24, 2026.
- Top gainer: CIFR +31.8% (small-cap). Top decliner: GLSI -20.5%.
- Return spread between the biggest gainer and biggest loser across all tiers was 52.3 percentage points — wide dispersion.
These are the top stock movers for the past week through July 24, 2026, broken down by market-cap tier. CIFR +31.8% was the single biggest move across all four tiers. For each tier, the top 3 gainers and top 3 decliners are listed with a plain-English catalyst note and a pattern-recognition read — whether the move looks like a clean breakout, momentum continuation, mean-reversion bounce, or extended run with reset risk.
Universe: ~145 curated US common stocks (NYSE + Nasdaq, ≥$300M market cap, ≥$1M average daily dollar volume). Cap tier reflects current market cap, not historical.
Mega-cap leaders (above $200B market cap)
Top gainers — past week
1. ↑ TMO +6.72%
$568.26 · avg $1,725M/day · Mega-cap
Why: Thermo Fisher delivered a strong Q2 with broad-based end-market growth and strategic portfolio moves, giving investors confidence that life-sciences tools demand is stabilizing after a long soft patch. RBC noted the beat wasn’t enough to meaningfully change H2 guidance, but the market rewarded execution and the tone-shift toward growth across segments.
Pattern: Clean earnings-driven breakout from a multi-week base above $530. Move is orderly rather than extended, with volume supporting the push. Room to run higher, but any give-back into the breakout zone would be a normal reset rather than distribution.
2. ↑ XOM +6.50%
$156.94 · avg $1,990M/day · Mega-cap
Why: Exxon rode a double tailwind: escalating Iran-related tensions kept a geopolitical premium in crude, and analysts flagged more upside for Big Oil even after a 25% YTD run. Positioning into next week’s earnings release added a bid, with the market treating XOM as a hedge against Middle East supply risk.
Pattern: Sustained trend continuation on rising volume, pushing to fresh highs. Momentum extended but not parabolic — pattern rhymes with prior oil-shock legs that held for several weeks before consolidating rather than sharply reversing.
3. ↑ AMD +5.28%
$521.95 · avg $14,019M/day · Mega-cap
Why: Lisa Su’s commentary that hyperscaler AI spend is delivering real returns reassured investors amid a broader capex-fear selloff. AMD held up while other AI names cracked, suggesting the market is discriminating winners on execution. Intel’s foundry stumble also redirected share-of-mind toward AMD as the credible x86 + AI alternative.
Pattern: Relative strength breakout — AMD advanced while the tech tape sold off, a bullish tell. Base above $500 looks constructive, though the +5% weekly gain against a red sector means any sector-wide flush could still drag AMD back to the breakout line.
Top decliners — past week
1. ↓ TSLA -17.81%
$313.03 · avg $18,563M/day · Mega-cap
Why: Tesla missed on Q2 earnings and Elon Musk’s refusal to rule out a Tesla-SpaceX merger on the call unsettled shareholders worried about capital reallocation and governance. Rising AI spending guidance compounded the concern. The stock lost nearly a fifth of its value as investors repriced both near-term margins and Musk-driven strategic uncertainty.
Pattern: Sharp earnings-gap breakdown through prior support at $360 and $340, closing near the weekly low — textbook distribution. Momentum is decisively down; any bounce toward $340 would likely see sellers. Reset potential exists but needs stabilization first.
2. ↓ ORCL -9.03%
$114.99 · avg $3,929M/day · Mega-cap
Why: Oracle reversed lower despite winning a Pentagon software deal, as investors questioned whether the stock’s outperformance versus enterprise peers was justified. The ‘left its peers behind — or has it?’ framing captures the mood: profit-taking after a strong run, compounded by broader software-sector weakness tied to capex-cycle fears.
Pattern: Failed breakout followed by a decisive break of the $120 shelf on rising volume. Pattern looks like the top of an extended move rather than a routine pullback. Watch $110-112 as the next support zone.
3. ↓ META -7.87%
$595.19 · avg $7,105M/day · Mega-cap
Why: META caught the broad Big Tech selloff triggered by AI capex fears, ahead of its own earnings next week. The ‘earnings crushing it, stocks getting crushed’ dynamic hit hardest names carrying elevated expectations. No company-specific bad news — just multiple compression as the market rethinks how much to pay for AI-heavy capex plans.
Pattern: Sharp pullback from recent highs but still above the prior consolidation base near $580. Looks more like a pre-earnings de-risking flush than a topping pattern. A hold above $580 would set up a reset; break below opens $560.
Large-cap leaders ($10B to $200B market cap)
Top gainers — past week
1. ↑ T +10.64%
$24.13 · avg $2,735M/day · Large-cap
Why: The telecom pair-trade caught a bid after Verizon’s Q2 beat and AI-deal narrative reset sentiment on the whole group. AT&T rode the read-through: if VZ’s turnaround is real and AI infrastructure means billions in incremental revenue for carriers, T looks cheap on the same thesis. Bond-proxy names also benefited from softer rate expectations.
Pattern: Clean breakout from a multi-month base above $23 on strong volume. Move looks constructive rather than extended — telecoms have been dormant, so this is early trend rather than late momentum. Follow-through above $24 opens more upside.
2. ↑ IREN +10.26%
$37.07 · avg $2,102M/day · Large-cap
Why: IREN’s $2.8B AI cloud contract win refocused investors on the neocloud story, with comparisons to Nebius framing IREN as a credible pick. The ‘shop the sell-off’ angle in high-flying tech also drew dip-buyers to the name. Bitcoin miners pivoting to AI infrastructure remain a favored 2026 theme.
Pattern: Momentum continuation with the move riding above the 20-day. Pattern is extended but not exhausted — the AI-neocloud narrative is drawing sustained flow. A pullback toward $34 would be a healthy reset; failure to hold there flips the read.
3. ↑ RTX +9.96%
$212.79 · avg $1,184M/day · Large-cap
Why: RTX beat Q2 estimates on strong aerospace and defense demand, with RBC highlighting broad-based strength across segments. Persistent Middle East tensions and record defense backlogs across the group (Lockheed, Boeing) reinforced the sector bid. Investors treated the print as validation that defense spending has structural legs into 2027 and beyond.
Pattern: Earnings breakout to fresh highs on strong volume — clean base-and-breakout structure. Momentum is healthy and the sector tape is supportive. Any pullback toward $205 would likely find buyers rather than trigger a rollover.
Top decliners — past week
1. ↓ CRWD -9.75%
$183.28 · avg $1,438M/day · Large-cap
Why: CrowdStrike sold off with no company-specific negative news — the pressure came from broad software-sector derating amid AI capex fears and pre-earnings de-risking. High-multiple cybersecurity names got hit hardest as investors questioned whether growth justifies the premium into an uncertain macro. Trending-stock coverage suggests retail chasing on the way down.
Pattern: Break below the $195 shelf on rising volume — looks like distribution rather than a shakeout. Trend has flipped short-term. Needs to reclaim $195 to invalidate; otherwise $175-180 is the next support zone to watch.
2. ↓ UBER -9.00%
$65.94 · avg $1,285M/day · Large-cap
Why: Uber cratered on a report that Alphabet’s Waymo may walk away from the robotaxi partnership. The market treats Waymo as Uber’s autonomy hedge — if the deal breaks, Uber’s long-term AV strategy looks weaker while Waymo could compete directly. Single-headline damage on a name that had priced in optionality.
Pattern: Sharp single-day breakdown through the $68 support, closing near the weekly low. Move looks driven by binary news rather than technical exhaustion. Reset potential if Waymo talks are re-confirmed; otherwise the next stop is likely $62-64.
3. ↓ AXP -8.21%
$326.17 · avg $1,170M/day · Large-cap
Why: American Express slid ahead of Q2 earnings amid broader consumer-discretionary and financials weakness — bitcoin holding while stocks posted a losing week captured the risk-off tone. No single AXP-specific catalyst; the move reads as pre-earnings positioning plus concerns about high-end consumer spending momentum into 2H.
Pattern: Pullback from recent highs on elevated volume, breaking the $340 shelf. Not yet distribution — closer to a controlled retracement into support at $325. Earnings will decide whether this is a reset or the start of a deeper leg.
Mid-cap leaders ($2B to $10B market cap)
Top gainers — past week
1. ↑ AMC +17.01%
$2.27 · avg $190M/day · Mid-cap
Why: AMC caught a lift from strength in the theatrical-exhibition thesis: IMAX crested a buy point on pre-‘Odyssey’ earnings surge, dragging sentiment across the group. No AMC-specific news — the move is a low-float sympathy rally with meme-stock kinetics on top of a genuinely improving box-office backdrop.
Pattern: Sharp bounce off deeply oversold levels below $2, but still capped by longer-term resistance. Pattern looks like a mean-reversion pop rather than a durable trend change. Move is extended on a percentage basis and prone to give-back if sentiment cools.
2. ↑ RNG +16.92%
$48.31 · avg $159M/day · Mid-cap
Why: RingCentral crushed Q2 estimates, raised the dividend 67%, and delivered strong revenue growth with AI-product expansion. The dividend boost was the surprise — it signals confidence in cash generation and gives a rate-sensitive floor to the stock. Combination of beat + capital return + AI story triggered a re-rating.
Pattern: Powerful earnings-gap breakout from a multi-month base — textbook constructive setup. Volume confirmed the move. Some near-term digestion is likely after a +17% week, but the base structure suggests continuation once the shakeout is complete.
3. ↑ FCEL +14.92%
$21.26 · avg $210M/day · Mid-cap
Why: FuelCell rode a sector-rotation bid into clean-energy names even as peers like Bloom and Plug sold off — FCEL benefited from a UBS diversification recommendation. An equity raise landing on strength suggests institutions are willing to fund the story. Fuel-cell narrative got mixed signals but FCEL emerged as the relative winner.
Pattern: Sharp rally on rising volume but the equity raise overhang caps the upside. Move looks extended and vulnerable to a pullback if the sector selloff resumes. Pattern reads as a momentum burst rather than a clean breakout.
Top decliners — past week
1. ↓ OPEN -14.78%
$3.84 · avg $319M/day · Mid-cap
Why: Opendoor sold off despite analyst target raises, with the ‘trading at a premium’ framing suggesting the recent run-up got ahead of fundamentals. No fresh negative catalyst — the move looks like profit-taking after a strong prior leg, compounded by weakness in housing-linked names as mortgage-rate optimism faded.
Pattern: Sharp pullback from recent highs, breaking short-term support at $4. Pattern is a reset from an extended move rather than a top — but needs to hold $3.60-3.75 to prevent a deeper flush. Low-priced name means percentage swings stay large.
2. ↓ HIMS -14.46%
$28.09 · avg $544M/day · Mid-cap
Why: Hims & Hers derated after a 313% run left the stock looking pricey on most metrics despite strong cash flow. The ‘cheap on cash flow but pricey after run’ framing captures the tension — investors are taking profits into strength. No single negative catalyst; more a valuation-driven cool-off after a monster move.
Pattern: Distribution off recent highs on elevated volume — classic parabolic exhaustion pattern. Move is not yet a full trend break, but momentum has flipped. Watch $27 as the next key level; a break there would confirm a deeper reset is underway.
3. ↓ LCID -14.40%
$6.30 · avg $95M/day · Mid-cap
Why: Lucid gave back part of its recent Tesla-defector rally as EV sentiment cooled with Tesla’s own crash. The ‘SpaceX anxiety or cracks under the hood’ framing captures investor confusion — LCID had been climbing 21% while Tesla fell 18%, and this week saw some of that trade unwind on broader EV concerns.
Pattern: Mean-reversion pullback after an outsized prior rally — extended move giving back gains rather than a fresh breakdown. Pattern suggests digestion; a hold above $6 keeps the rally structure intact, but low absolute price means volatility stays elevated.
Small-cap leaders ($300M to $2B market cap)
Top gainers — past week
1. ↑ CIFR +31.83%
$23.15 · avg $766M/day · Small-cap
Why: Cipher Mining ripped on the AI data-center pivot narrative, with coverage framing it as building a hyperscale future. Goldman highlighted AI junk bonds as a way to trade the theme, keeping capital flowing toward miners repositioning as AI infrastructure. Best-in-class weekly move on the strongest crypto-to-AI narrative.
Pattern: Explosive breakout on massive volume — clean momentum continuation. Move is extended and vulnerable to a sharp pullback, but the narrative flow suggests dips get bought. A test of $20 would be a normal reset; failure there would signal exhaustion.
2. ↑ RIOT +23.38%
$22.53 · avg $465M/day · Small-cap
Why: Riot rode the same AI-data-center pivot bid as CIFR and HUT, with Morgan Stanley flagging 141% upside for Hut 8 and framing miners as under-owned AI infrastructure plays. Bitcoin holding firm while equities fell added a defensive angle. Sector re-rating driven by narrative and analyst upgrades rather than company-specific news.
Pattern: Strong momentum leg breaking above prior consolidation on rising volume. Pattern is constructive but the +23% move puts it near-term extended. Any pullback toward $20 would likely find buyers; a hold above $22 keeps the trend intact.
3. ↑ HUT +20.27%
$109.99 · avg $528M/day · Small-cap
Why: Hut 8 rallied hard after Morgan Stanley slapped a $263 price target on the stock, calling out 141% upside on the AI data-center pivot. Bitcoin holding firm while stocks posted a losing week gave miners a relative-strength halo. Analyst-driven catalyst plus sector narrative equals sharp squeeze higher.
Pattern: Powerful trend continuation on the analyst catalyst — extended move but supported by sustained volume. Pattern rhymes with prior miner rallies that ran further than expected before pausing. A pullback toward $100 would be a healthy digestion pause.
Top decliners — past week
1. ↓ GLSI -20.47%
$12.98 · avg $4M/day · Small-cap
Why: No single clear catalyst — GLSI is a low-liquidity small-cap biotech ($4M daily volume) where individual investor flows can move the stock significantly. The drop likely reflects a combination of profit-taking after a prior run and general small-cap biotech weakness in a risk-off week for the broader market.
Pattern: Sharp decline on thin volume — pattern is more a liquidity-driven flush than a fundamental breakdown. Low daily dollar volume means the move can reverse just as quickly. Reset potential exists but requires a broader small-cap bid to return.
2. ↓ MVIS -16.10%
$0.25 · avg $3M/day · Small-cap
Why: No single clear catalyst — MicroVision is a sub-$1 lidar name with $3M daily volume where technical and flow dynamics dominate. The decline likely reflects continued erosion in speculative small-caps as the risk-off tone hit the most fragile names hardest, with no company-specific news to anchor sentiment.
Pattern: Trending decline continuing lower on light volume — pattern shows persistent distribution rather than a capitulation flush. At sub-$1 the stock is in a fragile zone where percentage moves stay large but recovery requires either a catalyst or a broader risk-on rotation.
3. ↓ EVGO -15.48%
$1.42 · avg $5M/day · Small-cap
Why: No single clear catalyst — EVGO sold off with the broader EV-and-charging complex as Tesla’s crash dragged sentiment across adjacent names. Low liquidity ($5M daily volume) amplified the move. No company-specific negative news, just sector guilt-by-association during a bad week for anything tied to the EV growth story.
Pattern: Trending decline breaking recent support on light volume — pattern is a continuation of the broader EV-infrastructure downtrend rather than a fresh event. Reset requires either sector-wide sentiment shift or a company catalyst; neither is on the near-term calendar.
What the past week cohort tells us
The week’s leadership split cleanly along two axes: AI-infrastructure exposure and defensive-cyclical strength. Small-caps produced the strongest winners — CIFR +32%, RIOT +23%, HUT +20% — all riding the bitcoin-miner-to-AI-data-center pivot narrative, with Morgan Stanley’s Hut 8 upgrade acting as the sector-wide catalyst. That’s significant because it shows real capital rotating into second-derivative AI plays even as first-derivative names (META, ORCL, CRWD) got sold on capex fears. The macro read is nuanced: this wasn’t a clean risk-off week (defense via RTX, oil via XOM, and telecoms via T all worked) but a rotation away from high-multiple mega-cap growth toward tangible-asset and cash-flow stories. Return dispersion was wide — a +32% winner and a -20% loser at the small-cap end signals a stock-picker’s tape rather than a beta-driven move. The Tesla -18% and Uber -9% breakdowns on company-specific news suggest investors are unwilling to pay for narrative optionality right now. Forward observation: the AI trade is bifurcating into ‘compute-consumers being questioned’ and ‘compute-hosts being rewarded’ — that split will likely widen into Big Tech earnings next week.
Bottom line
The top stock movers recap covers every US market-cap tier from mega ($200B+) to small ($300M-$2B). The Past Week view shows sustained leadership and sector rotation — complementary to the daily session recap (single-session moves, Tue-Sat morning Melbourne time).
Get early access to Orbit
Orbit is Luna3.ai’s AI-augmented research engine. 12 algorithmic signals + a gradient-boosted ML model + an agentic LLM that reads each top pick’s filings and writes a daily thesis with conviction score and catalyst proximity. Three regimes, three playbooks — growth in expansion, defensives in late-cycle, recovery plays at panic bottoms. The 3 in Luna3.ai.
No spam. Unsubscribe any time.
No comments yet. Be the first to share your thoughts!