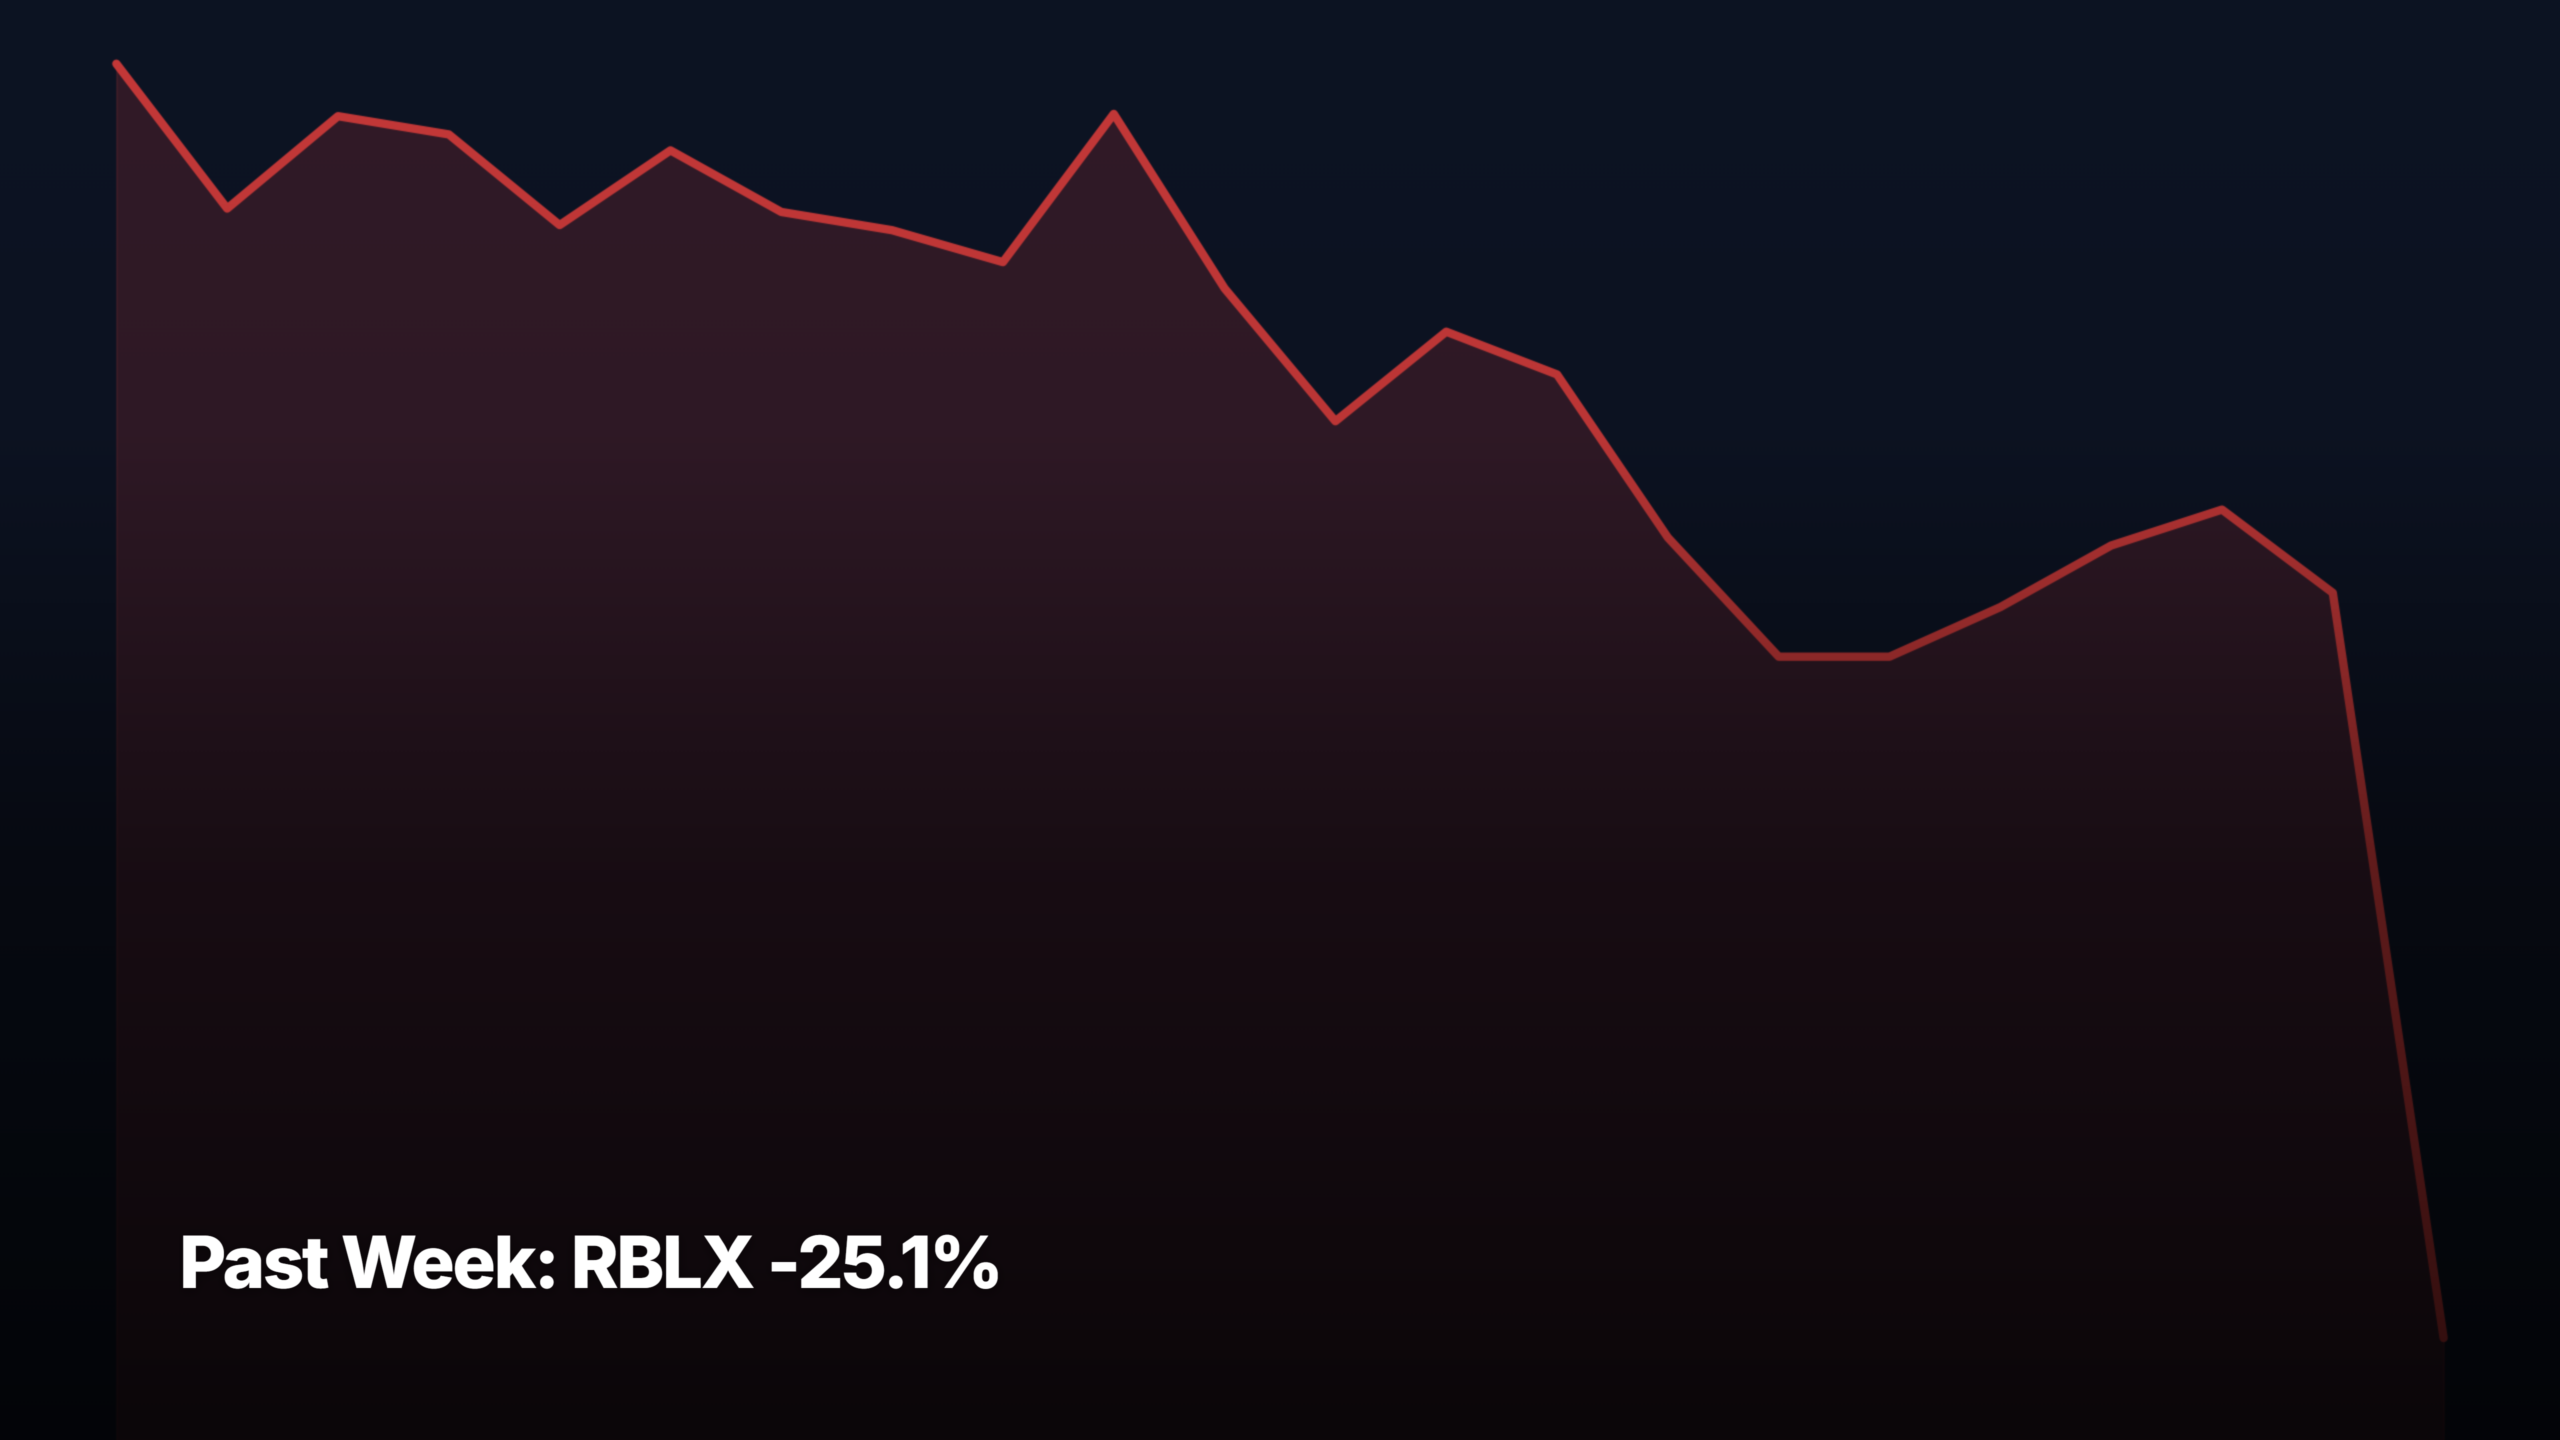
- RBLX -25.1% was the biggest decliner across all cap tiers over the past week through July 31, 2026.
- Top gainer: AMC +24.2% (mid-cap). Top decliner: RBLX -25.1%.
- Return spread between the biggest gainer and biggest loser across all tiers was 49.4 percentage points — wide dispersion.
These are the top stock movers for the past week through July 31, 2026, broken down by market-cap tier. RBLX -25.1% was the single biggest move across all four tiers. For each tier, the top 3 gainers and top 3 decliners are listed with a plain-English catalyst note and a pattern-recognition read — whether the move looks like a clean breakout, momentum continuation, mean-reversion bounce, or extended run with reset risk.
Universe: ~145 curated US common stocks (NYSE + Nasdaq, ≥$300M market cap, ≥$1M average daily dollar volume). Cap tier reflects current market cap, not historical.
Mega-cap leaders (above $200B market cap)
Top gainers — past week
1. ↑ MSFT +21.75%
$464.72 · avg $23,589M/day · Mega-cap
Why: Microsoft ripped +21.75% after a blowout earnings print where Azure growth and AI monetization silenced skeptics worried about hyperscaler capex. The tape treated the quarter as validation that heavy AI infrastructure spending is translating into real cloud revenue, not just a cost sink. Broader AI-spending narrative pulled the whole software complex higher into the print.
Pattern: Gap-and-go breakout from a multi-week base on record volume — a classic earnings-driven trend reset rather than a squeeze. Move is extended short-term (single-week +21% in a mega-cap is rare) and prone to a pullback toward the breakout shelf, but structure looks constructive not blow-off.
2. ↑ AMZN +17.00%
$271.58 · avg $17,349M/day · Mega-cap
Why: Amazon jumped ~17% after AWS re-accelerated in what the Street called a ‘home run’ quarter, easing the growing worry that cloud growth was stalling versus Azure and Google Cloud. Retail held up and operating leverage kept expanding. The print landed inside a broader week where investors rewarded companies proving AI capex is producing real revenue.
Pattern: Post-earnings breakaway gap on heavy volume clearing a well-defined multi-month base. Extended intraweek but constructive — the base was long enough to absorb sellers, and follow-through days without giving back the gap suggest institutional accumulation rather than a chase.
3. ↑ ORCL +12.94%
$129.87 · avg $4,137M/day · Mega-cap
Why: Oracle carried +12.94% on the sympathy bid from Microsoft and Amazon’s cloud strength, reinforcing the read that enterprise AI infrastructure demand is broadening beyond just the top two hyperscalers. Coverage highlighting Oracle’s multi-billion AI investment cycle added a fundamental hook to the flow-driven move.
Pattern: Trend continuation from an already-elevated base — Oracle is riding a longer uptrend rather than breaking out of a new one. Move looks momentum-extended and would benefit from a sideways digestion week; less reset potential than MSFT/AMZN since it started closer to prior highs.
Top decliners — past week
1. ↓ AMD -8.77%
$476.15 · avg $15,222M/day · Mega-cap
Why: AMD slid -8.77% into its earnings print as capital rotated toward names that had already reported clean cloud/AI beats (MSFT, AMZN). Some of the weakness looks like pre-earnings de-risking rather than a fundamental change — investors trimmed exposure ahead of a print where the bar was high after the hyperscaler capex reveal.
Pattern: Sharp pullback within an established uptrend — mean-reversion off recent highs rather than a topping pattern. Move looks tactical (pre-catalyst positioning) not structural; the earnings reaction itself will decide whether this becomes a base-building pause or a deeper trend reset.
2. ↓ AAPL -7.24%
$308.91 · avg $23,524M/day · Mega-cap
Why: Apple dropped -7.24% after Tim Cook flagged a memory-shortage impact and delivered a weaker revenue forecast, calling the supply situation a ‘100-year flood.’ The print landed at exactly the moment peers were rewarded for AI capex, sharpening the perception that Apple is a laggard in the AI infrastructure buildout that’s driving the rest of Big Tech.
Pattern: Gap-down breakdown from a distribution range on heavy volume — classic post-earnings trend break, not a shakeout. Sitting below recent support with no clear bounce level nearby; the setup skews toward continued weakness or a slow base-build rather than a quick snap-back.
3. ↓ META -6.47%
$556.71 · avg $12,622M/day · Mega-cap
Why: Meta fell -6.47% on the same AI-capex rethink that dinged non-hyperscaler mega-caps — investors questioning whether Meta’s spending pace is producing the same revenue leverage now visible at MSFT and AMZN. No single-name catalyst, more a relative-value rotation within Mag 7 toward names with cleaner AI-monetization proof.
Pattern: Controlled pullback within a longer uptrend — no gap, no volume climax. Looks more like profit-taking rotation than distribution; the move sits above key prior support and would need a decisive break lower to signal a real trend change.
Large-cap leaders ($10B to $200B market cap)
Top gainers — past week
1. ↑ ACN +12.88%
$165.92 · avg $1,406M/day · Large-cap
Why: Accenture climbed +12.88% on a rotation into AI-services beneficiaries as investors looked for who monetizes the enterprise AI buildout beyond the hyperscalers themselves. Coverage comparing Accenture’s revenue trajectory to Microsoft’s fed the narrative that consulting and integration work benefits directly from customer AI deployments.
Pattern: Sharp reversal off a multi-month base low — mean-reversion bounce with early breakout characteristics rather than an extended run. Move has room to extend if the AI-services rotation holds, but needs volume confirmation to graduate from bounce to trend.
2. ↑ NOW +12.60%
$111.23 · avg $3,444M/day · Large-cap
Why: ServiceNow gained +12.60% on the same enterprise-AI-monetization tailwind lifting Salesforce and Accenture. No single hard catalyst — broader coverage of cloud AI spending accelerating worldwide reinforced the case that Now’s AI product cycle is landing at exactly the right customer-budget moment.
Pattern: Momentum thrust off a rounding base — clean structure with rising volume. Not overextended yet and looks earlier in its move than the mega-cap winners this week; more base-and-breakout than blow-off.
3. ↑ CRM +12.44%
$184.02 · avg $2,659M/day · Large-cap
Why: Salesforce rallied +12.44% partly on coverage flagging its VA deal and undervaluation, alongside the broader software-and-services rotation. The week’s AI-monetization narrative pulled every enterprise software name that can credibly claim AI upsell exposure, and Salesforce screens cheap versus its own history.
Pattern: Bounce off a deeper base — more mean-reversion in flavor than the trending mega-cap breakouts. Structure looks like an early base build; needs to hold recent gains and print higher lows to confirm the reversal is real.
Top decliners — past week
1. ↓ QCOM -11.59%
$147.61 · avg $2,694M/day · Large-cap
Why: Qualcomm dropped -11.59% as capital rotated away from smartphone-levered semis and toward datacenter/AI-infrastructure names. Apple’s weak forecast and memory-supply commentary compounded the read on handset volumes into next year, and Qualcomm’s Apple-modem exposure remains a structural overhang.
Pattern: Breakdown from a topping range on expanding volume — trending decline rather than a one-off gap. Setup looks like continuation of a broader relative weakness versus AI-infrastructure semis; no clean bounce level until deeper support.
2. ↓ UPS -9.21%
$104.22 · avg $799M/day · Large-cap
Why: UPS fell -9.21% despite favorable China-US trade lane commentary — the reaction reflects broader concerns about consumer-parcel volumes and margin pressure that its own guidance framing didn’t quiet. Industrial and logistics names underperformed a tape led by cloud/AI winners.
Pattern: Continuation of an established downtrend — no reversal signature, just another leg lower on average volume. Pattern skews toward further weakness unless a catalyst breaks the sequence of lower highs and lower lows.
3. ↓ CAT -8.32%
$814.81 · avg $3,081M/day · Large-cap
Why: Caterpillar slid -8.32% into its Q2 print as investors de-risked cyclicals ahead of earnings while crowding into cloud/AI winners. No single negative catalyst — the move reads as rotation out of industrials rather than a company-specific reset, with the earnings reaction still to determine the next leg.
Pattern: Sharp pullback from recent highs — pre-earnings de-risking pattern rather than a topping structure. Sitting near a multi-week support shelf; the earnings response will decide whether this becomes a launch pad for a bounce or a proper trend break.
Mid-cap leaders ($2B to $10B market cap)
Top gainers — past week
1. ↑ AMC +24.23%
$2.82 · avg $119M/day · Mid-cap
Why: AMC popped +24.23% on coverage highlighting a record-breaking Spider-Man preview night and an analyst call that streaming didn’t kill theaters after all. A credit upgrade added a fundamental hook. At $2-$3 this is still a small-dollar move on retail-heavy flow, so headlines punch above their weight.
Pattern: Sharp bounce off a low base — mean-reversion with squeeze characteristics rather than a real trend change. High reset potential; low-priced meme-adjacent names of this profile rarely hold week-one gains without follow-through catalyst.
2. ↑ ASAN +21.28%
$8.32 · avg $60M/day · Mid-cap
Why: Asana surged +21.28% as part of a broader productivity-software bid alongside peers like Bentley Systems and PagerDuty. No standalone catalyst in the headlines — this looks like a rotation trade into oversold small-and-mid-cap SaaS names benefiting from the week’s AI-spending optimism.
Pattern: Sharp bounce off a beaten-down base — classic mean-reversion setup in an oversold name. Move looks extended intraweek and vulnerable to give-back; would need volume follow-through and a higher low to shift from bounce to trend.
3. ↑ PATH +17.71%
$12.76 · avg $667M/day · Mid-cap
Why: UiPath rallied +17.71% on renewed ‘undervalued after slump’ coverage combined with the sector-wide AI-automation bid. The stock has been deeply washed out for months, so any positive re-framing plus a friendly tape produces outsized moves — no single company-specific catalyst.
Pattern: Reflex bounce off multi-month lows on above-average volume — mean-reversion, not a base breakout. Extended reset potential given the depth of the prior downtrend; needs to build a higher low before this counts as a real reversal attempt.
Top decliners — past week
1. ↓ RBLX -25.13%
$35.60 · avg $908M/day · Mid-cap
Why: Roblox collapsed -25.13% on what coverage called its worst day ever after earnings, hit with a Wedbush downgrade to Neutral citing soft Q3 outlook and limited forward visibility. The disappointment landed in a week where growth names generally worked, sharpening the punishment for anyone missing.
Pattern: Gap-down breakdown on climactic volume — distribution top after an extended run. Move is severe but not necessarily finished; post-earnings gaps of this magnitude typically need time and a proper base to repair before a real bounce sets up.
2. ↓ TDOC -23.49%
$6.71 · avg $75M/day · Mid-cap
Why: Teladoc plunged -23.49% on disappointing Q2 results that reset expectations sharply lower, according to sell-side coverage flagging the stock as materially undervalued only after the drop. The reaction fits a pattern of chronic disappointment at this name — every guide-down produces another leg lower.
Pattern: Continuation breakdown to fresh lows on heavy volume — trending decline pattern with no reversal signature. High risk of further weakness; investors trying to catch this typically need to see a base form for weeks before a real bounce takes hold.
3. ↓ HOOD -8.80%
$86.56 · avg $2,042M/day · Mid-cap
Why: Robinhood dropped -8.80% on crypto-slump concerns weighing on the trading-revenue mix, even as Bernstein raised its price target to $160. The tension between a strong analyst call and softer crypto activity produced a de-risk move rather than a decisive breakdown.
Pattern: Pullback within a longer uptrend — mean-reversion off recent highs, not a top. Sitting above key prior support with rising longer-term structure intact; setup skews toward base-building rather than trend break unless crypto weakness deepens.
Small-cap leaders ($300M to $2B market cap)
Top gainers — past week
1. ↑ QBTS +11.54%
$18.08 · avg $472M/day · Small-cap
Why: D-Wave gained +11.54% on coverage flagging its AT&T enterprise win as quietly redefining its competitive position, alongside broader quantum-computing enthusiasm sparked by an IBM headline about progress on quantum error correction. The whole quantum basket bid together.
Pattern: Momentum continuation within an already-elevated uptrend — extended structure with meaningful reset potential. Quantum names trade as a correlated basket and can unwind fast when sentiment turns; a wider pullback across the group is a real risk.
2. ↑ EVGO +11.27%
$1.58 · avg $6M/day · Small-cap
Why: EVgo gained +11.27% on no clear single catalyst — no single clear catalyst — most plausibly a broader small-cap EV-infrastructure bid on a week where risk-on flows lifted beaten-down clean-energy names. At $1.42 to $1.58 the dollar move is small; percentage return is amplified by the low share price.
Pattern: Reflex bounce off a sub-$1.50 base — the kind of move that happens routinely in low-priced names without necessarily marking a trend change. Very high reset potential; needs volume and a fundamental hook to graduate from noise to signal.
3. ↑ IONQ +10.96%
$36.44 · avg $781M/day · Small-cap
Why: IonQ rose +10.96% after the FTC approved its acquisition of SkyWater’s semiconductor foundry, giving it US chip-fabrication access — a genuine strategic step for a quantum-hardware company. Broader quantum-basket bid amplified the move.
Pattern: News-driven breakout within an existing uptrend on above-average volume. Cleaner structural read than QBTS because it has a real M&A catalyst; still extended and correlated to the broader quantum basket, so pullback risk from a group unwind remains.
Top decliners — past week
1. ↓ RIOT -10.47%
$20.17 · avg $413M/day · Small-cap
Why: Riot dropped -10.47% as bitcoin mining difficulty fell alongside a rangebound crypto tape that offered no upside catalyst into Q2 earnings. Miners de-rate quickly when bitcoin price action stalls, and Riot moved with the broader miner cohort rather than on anything company-specific.
Pattern: Continuation of a downtrend within a broader miner weakness — no reversal signature. Fate tied more to bitcoin price than to Riot’s own operations near-term; a bitcoin break either way would drive the next leg here.
2. ↓ BLDP -7.93%
$2.67 · avg $20M/day · Small-cap
Why: Ballard Power slipped -7.93% after a Q2 earnings call that offered nothing to reset the negative narrative around fuel-cell demand. Clean-hydrogen names remain out of favor and Ballard trades more on sentiment about the broader hydrogen theme than on quarterly results.
Pattern: Slow bleed within an established downtrend — no volume climax, no clear support. Pattern skews toward continued grind lower unless a hydrogen-policy or contract catalyst arrives to reset the sentiment on the whole basket.
3. ↓ KEEL -6.81%
$3.97 · avg $155M/day · Small-cap
Why: KEEL fell -6.81% despite a favorable comparison to Nebius in one piece of coverage. In the absence of a hard catalyst, the pullback looks like profit-taking after the stock’s strong recent run — investors trimming exposure in a name that had already moved a lot before this week.
Pattern: Pullback within a longer uptrend — mean-reversion off elevated levels rather than a topping pattern. Structure remains intact if the stock holds above its recent base; needs to avoid a lower low to keep the trend read positive.
What the past week cohort tells us
The strongest leadership this week came from mega-cap and large-cap software — MSFT +21.75%, AMZN +17.00%, ORCL +12.94%, ACN +12.88%, NOW +12.60%, CRM +12.44% — a tight cluster driven by a single narrative: AI-infrastructure capex is now visibly producing cloud and enterprise-software revenue. That’s a growth-and-risk-on signal, but a narrow one; the winners share a specific business model, not a broad reflationary tone. The laggard pattern reinforces this — AAPL, META, AMD, QCOM, UPS, CAT all pulled back, meaning consumer-hardware, industrials, and non-hyperscaler semis got rotated OUT to fund the cloud bid. Return dispersion is wide (from +24% AMC to -25% RBLX), which usually signals a catalyst-heavy tape rather than a broad market move — earnings season is doing the sorting. Small-cap gainers concentrated in speculative pockets (quantum, EV, meme) rather than a genuine risk-on small-cap thrust, which tempers the risk-on read. Forward observation: the market is paying a premium for verifiable AI monetization and punishing names that either miss (RBLX, TDOC) or can’t tell a clean AI story (AAPL) — that discrimination is likely to intensify, not fade, into the next earnings wave.
Bottom line
The top stock movers recap covers every US market-cap tier from mega ($200B+) to small ($300M-$2B). The Past Week view shows sustained leadership and sector rotation — complementary to the daily session recap (single-session moves, Tue-Sat morning Melbourne time).
Get early access to Orbit
Orbit is Luna3.ai’s AI-augmented research engine. 12 algorithmic signals + a gradient-boosted ML model + an agentic LLM that reads each top pick’s filings and writes a daily thesis with conviction score and catalyst proximity. Three regimes, three playbooks — growth in expansion, defensives in late-cycle, recovery plays at panic bottoms. The 3 in Luna3.ai.
No spam. Unsubscribe any time.
No comments yet. Be the first to share your thoughts!