
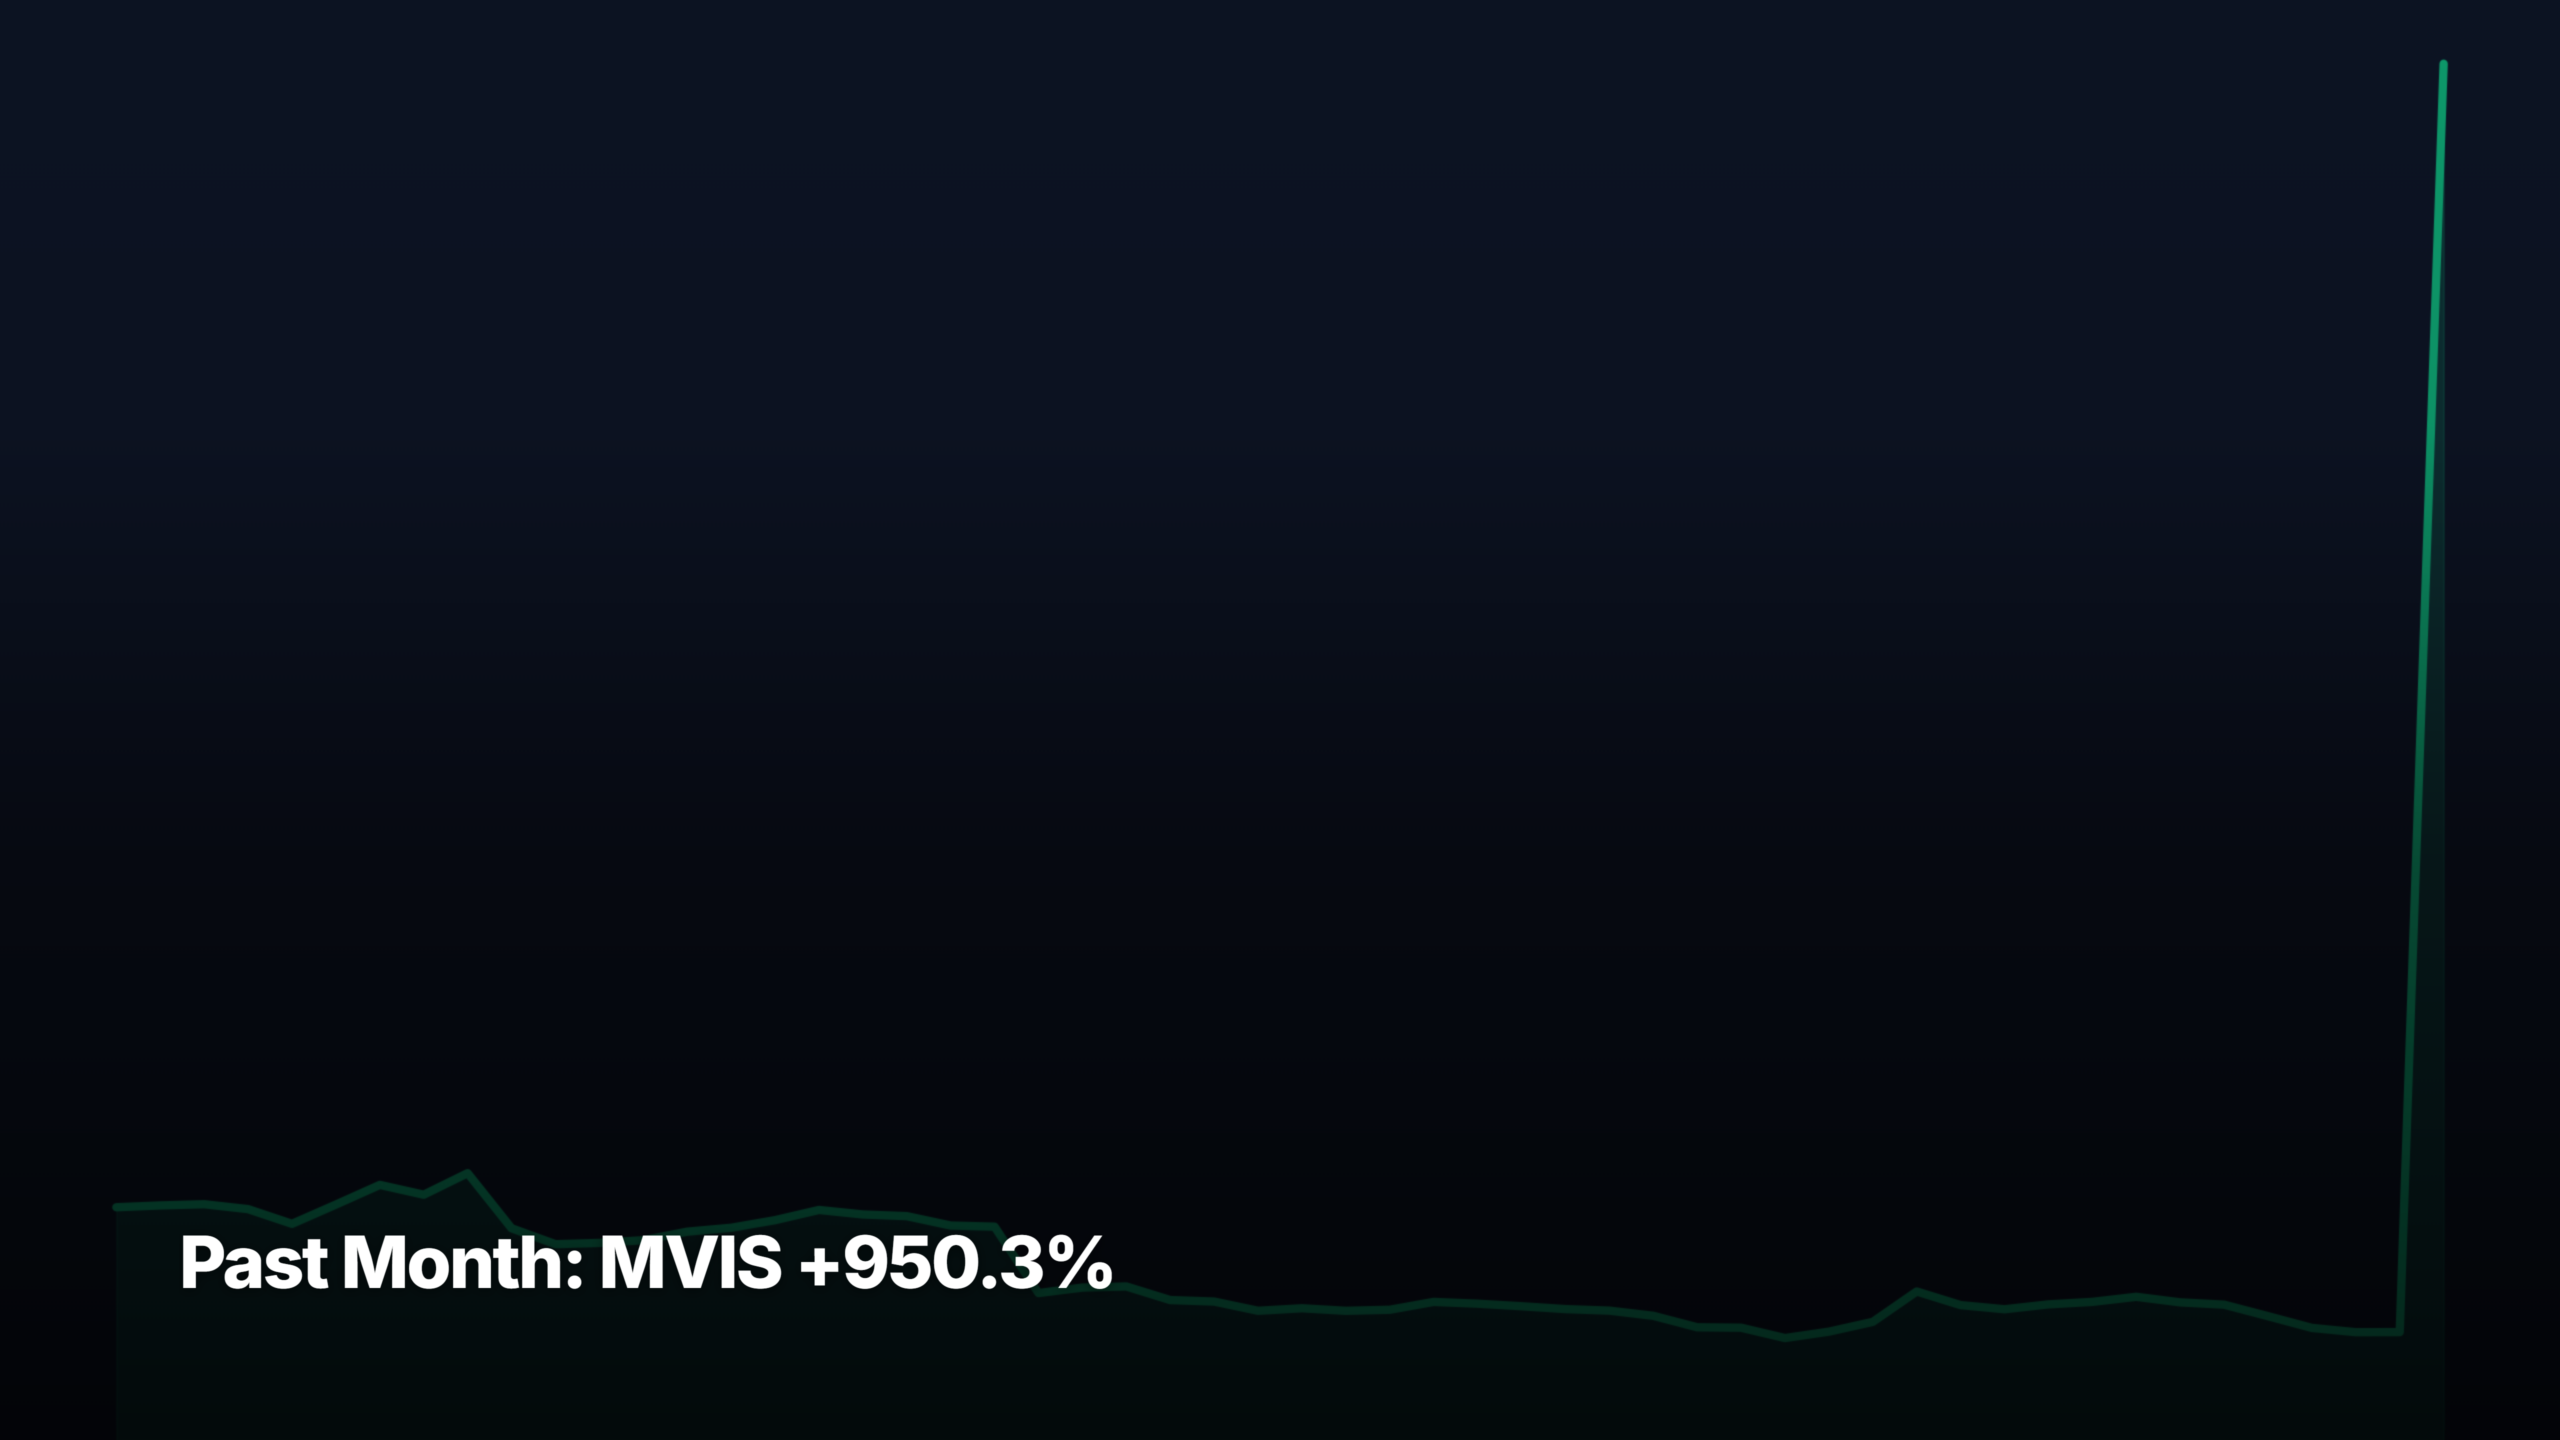
- MVIS +950.3% was the biggest gainer across all cap tiers over the past month through July 31, 2026.
- Top gainer: MVIS +950.3% (small-cap). Top decliner: GLSI -42.5%.
- Return spread between the biggest gainer and biggest loser across all tiers was 992.7 percentage points — wide dispersion.
These are the top stock movers for the past month through July 31, 2026, broken down by market-cap tier. MVIS +950.3% was the single biggest move across all four tiers. For each tier, the top 3 gainers and top 3 decliners are listed with a plain-English catalyst note and a pattern-recognition read — whether the move looks like a clean breakout, momentum continuation, mean-reversion bounce, or extended run with reset risk.
Universe: ~145 curated US common stocks (NYSE + Nasdaq, ≥$300M market cap, ≥$1M average daily dollar volume). Cap tier reflects current market cap, not historical.
Mega-cap leaders (above $200B market cap)
Top gainers — past month
1. ↑ MSFT +24.58%
$464.72 · avg $23,986M/day · Mega-cap
Why: Microsoft’s cloud revenue surge — Azure and AI-services demand from enterprise customers — pulled the stock higher through July. The ‘Big Tech AI shakeout’ narrative also concentrated capital into perceived winners with real AI monetisation, and MSFT sits at the top of that list. No single earnings-day gap; the move built steadily across the month.
Pattern: Clean stair-step advance from the $373 base with higher lows through the month — the kind of grinding trend that reflects institutional accumulation rather than a squeeze. Extended relative to the 20-day average but no obvious blow-off top yet; a shallow pullback would be normal here.
2. ↑ ADBE +22.14%
$250.41 · avg $1,808M/day · Mega-cap
Why: No single clear catalyst — Adobe rode the same enterprise-AI capital rotation that lifted MSFT and INTU, with sentiment shifting on the view that its Firefly and Creative Cloud AI features are starting to convert into paid seats. Peer strength in productivity-software names amplified the move.
Pattern: Breakout from a multi-month base above $205 with expanding volume — textbook base-and-breakout structure. Move is now roughly 22% off the base, so extended in the short term; a mean-reversion pullback to the breakout zone would not be surprising.
3. ↑ CVX +18.74%
$196.83 · avg $1,515M/day · Mega-cap
Why: Rising oil prices in July — driven by Middle East supply concerns including Chevron’s own discussions with Iraq on a pipeline to bypass the Strait of Hormuz — lifted the whole integrated-oil complex. Dividend-yield rotation also flowed into large energy names as investors sought defensive cash flow alongside the tech rally.
Pattern: Steady trending advance without any single spike day — the shape of a sector rotation rather than a stock-specific catalyst. Momentum looks healthy but the +19% move stretches CVX relative to its longer-run range; any oil pullback would likely bleed through quickly.
Top decliners — past month
1. ↓ TSLA -26.01%
$311.21 · avg $12,202M/day · Mega-cap
Why: Tesla underperformed as SpaceX’s Nasdaq-100 inclusion pulled ‘Musk-premium’ capital toward the newer story, and the broader EV group weakened — Morgan Stanley’s cautious Rivian note captured the mood. No single earnings blow-up; more a slow bleed as growth-tech leadership narrowed to AI-infrastructure names.
Pattern: Trending decline with lower highs and lower lows across the month — clean distribution pattern, not a one-day gap. Down 26% now sits meaningfully below the 20-day average, so oversold-bounce potential exists, but the structural trend break argues against chasing the first rebound.
2. ↓ AMD -18.03%
$476.15 · avg $15,336M/day · Mega-cap
Why: AMD gave back gains ahead of its early-August earnings print, with investors de-risking after a strong prior run. The ‘AI infrastructure dip’ framing from Morgan Stanley captured the rotation — capital moved from second-tier AI silicon toward NVDA and hyperscalers with clearer near-term revenue visibility.
Pattern: Distribution top followed by a controlled decline — the shape of profit-taking, not panic. Down 18% into an earnings catalyst, so the setup is now binary: a beat likely triggers a sharp mean-reversion bounce; a miss opens room toward the prior base.
3. ↓ ORCL -11.07%
$129.87 · avg $4,278M/day · Mega-cap
Why: Oracle sold off alongside other AI-adjacent names as investors questioned the payback on its heavy capex build-out. The Gemini partnership framing raised as many questions as it answered about ORCL’s own AI positioning, and the stock lost the ‘pure-play cloud AI winner’ bid it had earlier in the year.
Pattern: Rolling top with a decisive break below the prior support shelf near $140 — classic distribution structure. Down 11% is milder than AMD or INTC but the trend break is real; needs to reclaim $140 to void the pattern, otherwise the next test is the prior consolidation zone.
Large-cap leaders ($10B to $200B market cap)
Top gainers — past month
1. ↑ ACN +34.94%
$165.92 · avg $1,561M/day · Large-cap
Why: Accenture bounced hard off a deeply oversold base, with the ‘IT services can monetise enterprise AI implementations’ thesis catching a bid after months of scepticism. Headlines noting ACN ‘outperforming the broader market’ captured the momentum shift as capital rotated into laggards with defensive cash flow.
Pattern: Sharp mean-reversion bounce from a multi-month base near $123 — the +35% move is the biggest gainer in the large-cap tier and shows the coiled-spring behaviour of oversold names catching a bid. Extended near-term; needs to hold above $150 to confirm a real trend change.
2. ↑ PYPL +32.49%
$57.21 · avg $903M/day · Large-cap
Why: PayPal was flagged among July’s best S&P 500 stocks as investors warmed to the tokenisation and stablecoin-payments narrative — the Equiniti Nasdaq event on trillion-dollar tokenisation captured that thematic bid. Underlying, PYPL’s profitability story finally started to register after quarters of margin-recovery work.
Pattern: Powerful breakout from a long basing structure below $45 with volume expansion — the cleanest base-and-breakout in this cohort. Up 32% is extended, but bases this long often support longer trend legs; a pullback to the $50-52 breakout zone would be a healthy retest, not a failure.
3. ↑ INTU +21.64%
$316.07 · avg $1,484M/day · Large-cap
Why: Intuit rode strong Q3 results plus the AI-restructuring narrative — investors are now willing to underwrite a valuation premium for fintech names showing genuine AI cost-out and product uplift. The ‘undervalued after Q3’ framing pulled buyers back into a name that had drifted through spring.
Pattern: Post-earnings gap higher followed by a steady trending advance — the ideal shape after a beat. Move looks earned rather than speculative, though at +22% it is now extended enough that a pause or shallow retracement to the $290-300 zone would fit typical post-gap behaviour.
Top decliners — past month
1. ↓ INTC -35.40%
$90.20 · avg $12,120M/day · Large-cap
Why: Intel collapsed as TSMC’s advanced-packaging push directly targets Intel’s Foundry differentiation — the one lever new CEO Lip-Bu Tan was betting on. Combined with the broader ‘buy the AI infrastructure dip’ commentary pointing readers toward better-positioned names, INTC lost both the AI narrative and the foundry moat argument in one month.
Pattern: Trending decline that accelerated mid-month — the shape of a fundamental repricing, not a technical shakeout. Down 35% is deeply oversold and a bounce is likely, but the structure argues bounces will be sold; needs a clear catalyst-driven reversal to void.
2. ↓ CAT -23.34%
$814.81 · avg $3,082M/day · Large-cap
Why: Caterpillar reversed sharply as investors reassessed the ‘data-centre construction beneficiary’ narrative that had powered the stock into July. Terex’s Q2 commentary flagged softer end-market demand, and the Morgan Stanley infrastructure-dip note pulled capital toward more direct AI plays rather than industrial derivatives.
Pattern: Distribution top after a strong prior run, with a decisive break of the $1,000 shelf — classic exhaustion pattern after an extended move. Down 23% still hasn’t fully reset the prior rally; reset potential remains toward the mid-$700s if the AI-capex-derivative bid keeps unwinding.
3. ↓ IBM -20.47%
$223.65 · avg $2,200M/day · Large-cap
Why: IBM sold off after the CEO’s ‘blunt message on quantum computing’ recalibrated expectations for how soon that segment monetises — investors had been paying up for the quantum optionality. The Alphabet-vs-IBM revenue-divergence framing then crystallised the concern that IBM’s AI story is trailing hyperscaler peers.
Pattern: Break of the multi-month uptrend with a gap-and-drift structure — controlled selling rather than panic. Down 20% now sits near prior support in the low $220s; a bounce is plausible but the trend break needs a real catalyst to reverse, not just oversold mean-reversion.
Mid-cap leaders ($2B to $10B market cap)
Top gainers — past month
1. ↑ AMC +48.42%
$2.82 · avg $119M/day · Mid-cap
Why: AMC surged on the S&P credit upgrade citing improved operations and lower debt — a genuine balance-sheet catalyst rather than a meme-driven pop. Live Nation’s strong Q2 also lifted the live-entertainment cohort broadly, and AMC’s low share price makes percentage moves outsized on modest dollar flow.
Pattern: Extended momentum move from a low base — the +48% return on a $2 stock reflects thin float dynamics as much as fundamental repricing. Chart looks vertical and short-term overbought; these credit-upgrade pops on low-priced names typically retrace 30-50% before the next leg.
2. ↑ RNG +42.69%
$55.62 · avg $169M/day · Mid-cap
Why: No single clear catalyst in the last 72 hours — RingCentral’s move looks like a mean-reversion bounce in a beaten-down cloud-communications name catching the broader software-AI rotation bid. When laggards this deep start to move, it usually reflects short-covering plus early rotation from investors hunting non-consensus AI plays.
Pattern: Sharp reversal from a multi-quarter downtrend base — the shape of short-covering plus early accumulation. Up 43% is extended and the lack of a hard news catalyst means the move is fragile; a pullback to test the breakout zone near $45 would be a healthier setup than chasing here.
3. ↑ BILL +24.81%
$45.13 · avg $112M/day · Mid-cap
Why: BILL rode the same fintech-AI bid that lifted INTU and PYPL, with the ‘Intuit or BILL’ comparison framing bringing incremental attention to BILL as a growth-at-reasonable-price alternative. The recent single-day pullback flagged in headlines suggests the move already saw some profit-taking near the top.
Pattern: Base-and-breakout from the mid-$30s with a decisive move through the $40 shelf — clean structure, though the intraday reversal headline hints at distribution starting near $45. Up 25% is moderately extended; a retest of the $40 breakout would confirm real trend change.
Top decliners — past month
1. ↓ FCEL -39.99%
$21.61 · avg $195M/day · Mid-cap
Why: No single clear catalyst in the last 72 hours — FuelCell’s decline looks like a reversal of a prior speculative run in the hydrogen and clean-energy complex. When micro-caps in a thematic pocket sell off without news, it typically reflects the marginal buyer disappearing and momentum funds unwinding, not new negative information.
Pattern: Trending decline with lower highs and lower lows across the month — classic momentum-unwind pattern after a speculative rally. Down 40% resets a chunk of the prior move but the trend is broken; oversold bounces likely, but the primary trend argues against catching this one.
2. ↓ RBLX -34.53%
$35.60 · avg $923M/day · Mid-cap
Why: Roblox cratered on concerns that recommendation and safety reworks are hurting bookings — a real fundamental hit to the growth story. The ‘Roblox and Reddit both crashed more than 20%’ framing captured that the market is now punishing any consumer-internet name where product changes threaten near-term monetisation.
Pattern: Distribution top followed by a sharp trend break — the shape of a growth-narrative reset, not a technical wobble. Down 35% is severe but bookings-driven repricings often need multiple quarters to base; oversold-bounce trades possible, but structural buyers should want to see the bookings trend stabilise first.
3. ↓ BYND -24.53%
$0.57 · avg $10M/day · Mid-cap
Why: No single clear catalyst — Beyond Meat continued its long decline, with the new COO hire from Olam noted but not viewed as changing the fundamental demand picture. At $0.57 the stock is trading closer to a distressed-equity option than a going-concern equity, and any move is dominated by that dynamic.
Pattern: Trending decline in a sub-$1 stock — the chart is essentially a slow drift lower punctuated by short-covering spikes. Down 25% at these levels is noise inside a broken structure; the real question is delisting risk, not chart pattern, and the pattern will follow whichever way that resolves.
Small-cap leaders ($300M to $2B market cap)
Top gainers — past month
1. ↑ MVIS +950.28%
$3.99 · avg $2M/day · Small-cap
Why: No single clear catalyst in the last 72 hours — MicroVision’s near-thousand-percent move on thin $2M average daily dollar volume points to a low-float squeeze or speculative rotation into a beaten-down lidar name, not a fundamental re-rating. Moves this size without disclosed news require caution — either something leaked or the momentum crowd found a vehicle.
Pattern: Vertical move from a sub-$1 base — the definitional shape of a low-float squeeze. Up 950% is extraordinarily extended and these patterns typically give back 50-80% of the move within weeks; the reset potential is enormous and mean-reversion risk dominates any technical read here.
Top decliners — past month
1. ↓ GLSI -42.46%
$13.50 · avg $2M/day · Small-cap
Why: No single clear catalyst in the last 72 hours — Greenwich LifeSciences’ decline looks like a reversal after prior speculative interest, typical of small-cap biotechs where price is driven more by pipeline expectations and short-term sentiment than any monthly news flow. Thin $2M daily dollar volume amplifies moves in both directions.
Pattern: Trending decline from an extended prior base — down 42% cuts through prior support levels cleanly. Small-cap biotechs in this shape often need a data catalyst to reverse the trend; without one, mean-reversion bounces get sold and the primary trend argues for more downside probing.
2. ↓ STUB -34.42%
$8.44 · avg $33M/day · Small-cap
Why: No single clear catalyst in the last 72 hours — StubHub’s decline likely reflects post-IPO overhang and profit-taking in ticketing names after Live Nation’s strong Q2 concentrated the sector bid on the incumbent. Consumer-discretionary sentiment softening into August also pressured live-events adjacents.
Pattern: Trending decline that broke a prior consolidation shelf — the shape of a young public company still finding its buyer base. Down 34% is severe enough that oversold bounces should trigger, but without a clear fundamental catalyst the trend probably needs a base to form before real recovery.
3. ↓ ASTS -33.63%
$58.98 · avg $647M/day · Small-cap
Why: AST SpaceMobile pulled back sharply despite continued BlueBird constellation progress — the market appears to have priced in a lot of execution and is now discounting the timing risk of the deployment ramp. The ‘ASTS vs Rocket Lab’ framing shows investors are also actively rotating within the space-network cohort, and ASTS lost the bid this month.
Pattern: Distribution top followed by a sharp trend break — classic exhaustion pattern after an extended run. Down 34% resets a chunk of the prior move but ASTS remains valuation-sensitive; the reset potential extends further if constellation milestones slip, though a real deployment update could snap the pattern back quickly.
What the past month cohort tells us
Return dispersion is unusually wide this month — MVIS at +950% on the small-cap top and INTC at -35% on the large-cap bottom bracket a cohort with more spread than the typical month, which signals a market in active rotation rather than a directional tape. The strongest winners cluster in enterprise software and fintech (MSFT, ADBE, INTU, PYPL, ACN, BILL), while the biggest losers cluster in AI-adjacent hardware and industrial derivatives (INTC, CAT, IBM, AMD, ORCL) — that is a decisive rotation from ‘AI capex beneficiaries’ toward ‘AI monetisation winners’. Capital is now paying for software companies that can turn AI into recurring revenue and de-rating names whose story rests on selling picks and shovels. The large-cap tier produced the most durable-looking breakouts (ACN, PYPL), while the mega-cap tier showed the sharpest trend breaks (TSLA, INTC in the peer group). Small-cap moves are dominated by float dynamics, not fundamentals. Forward-looking: if this rotation persists, watch whether Q3 earnings from software winners validate the premium — a single disappointment in MSFT or INTU could unwind the rotation quickly.
Bottom line
The top stock movers recap covers every US market-cap tier from mega ($200B+) to small ($300M-$2B). The Past Month view shows sustained leadership and sector rotation — complementary to the daily session recap (single-session moves, Tue-Sat morning Melbourne time).
Get early access to Orbit
Orbit is Luna3.ai’s AI-augmented research engine. 12 algorithmic signals + a gradient-boosted ML model + an agentic LLM that reads each top pick’s filings and writes a daily thesis with conviction score and catalyst proximity. Three regimes, three playbooks — growth in expansion, defensives in late-cycle, recovery plays at panic bottoms. The 3 in Luna3.ai.
No spam. Unsubscribe any time.
No comments yet. Be the first to share your thoughts!