
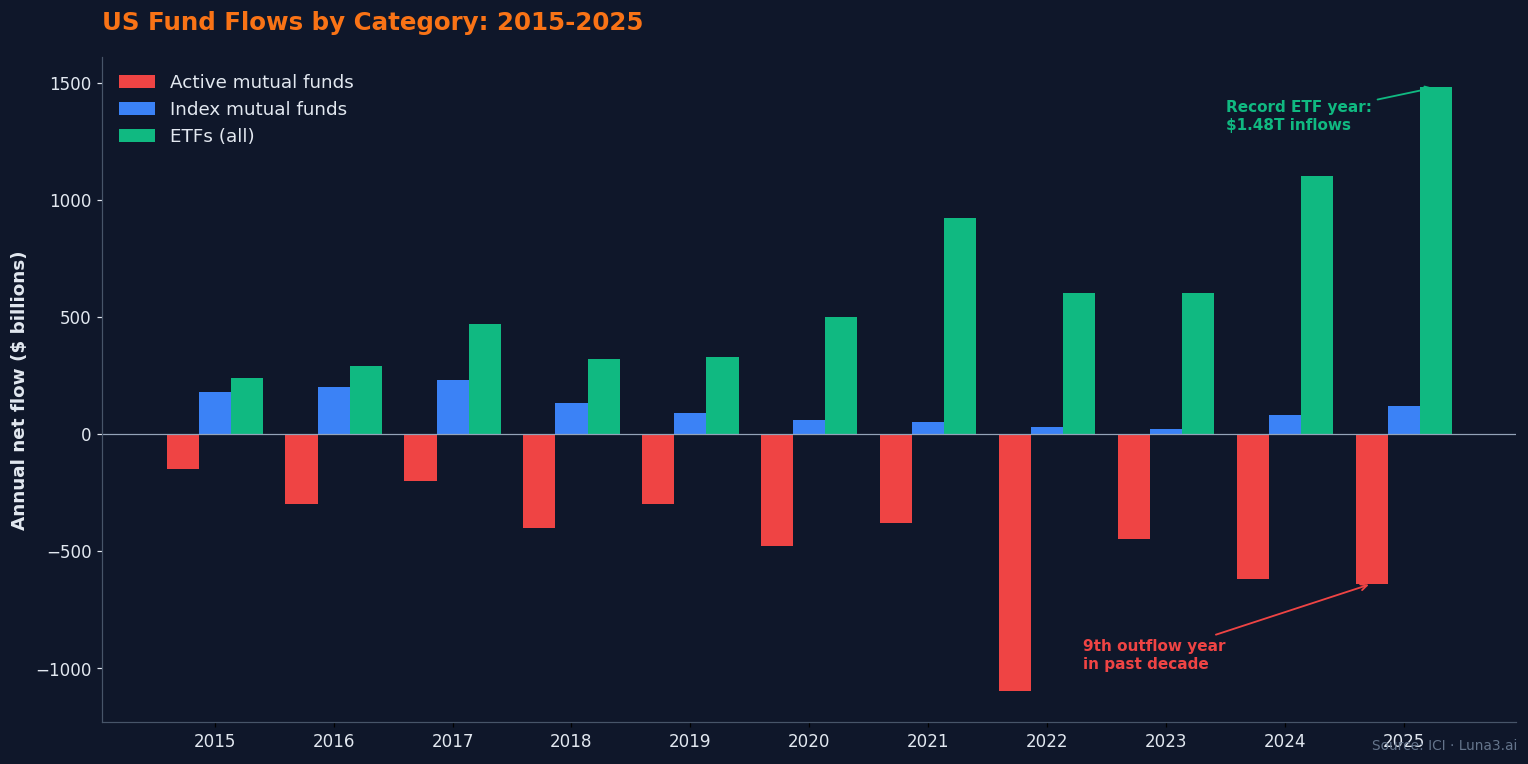
- Active mutual funds bled $640 billion in net outflows in 2025 while ETFs absorbed a record $1.48 trillion — passive AUM surpassed active for the first time in late 2024.
- SPIVA's Year-End 2025 scorecard shows 79% of US large-cap active funds underperformed the S&P 500, the fourth-worst year in the scorecard's 25-year history.
- Active still earns its fee in narrow corners — US small-cap had its best year on record in 2025, and selectivity matters in emerging markets and fixed income.
The active vs passive funds debate ended quietly in late 2024. That was the month, according to Morningstar’s industry data, that total US passive fund assets surpassed active strategies for the first time. By December 2025, passive held $19.3 trillion against $17.4 trillion in active — and the gap was still widening at a rate the active industry has no clear playbook to reverse.
The numbers behind that crossover are stark. In 2025, US active mutual funds saw $640 billion in net outflows, per the Investment Company Institute. ETFs — overwhelmingly passive vehicles — absorbed a record $1.48 trillion in net inflows. The mutual fund-to-ETF rotation gap ballooned from $890 billion in 2024 to $1.79 trillion in 2025, the largest single-year migration ever recorded. This post unpacks what happened across three lenses: the flow data, the SPIVA scorecard, and the structural reasons active loses — plus the narrow corners where active still earns its fee.
The 2025 Fund-Flow Scoreboard
Fund flows are the cleanest measurement of what investors are actually doing — not what they say in surveys, not what advisors recommend, but where the money lands. The 2025 numbers tell a single story.
The $640 billion in active mutual fund outflows marked the ninth net-outflow year out of the past ten for the category, per ICI’s combined active and index flow data. The single most concentrated quarter was Q4 2025, when active equity funds alone shed $257.5 billion — investors selling into year-end strength and tax-loss harvesting accelerated the rotation. December’s monthly active mutual fund outflow ran $86.1 billion. By contrast, December index mutual funds pulled in $162.8 billion in net inflows, and US ETFs added $1.48 trillion across the full year — the highest annual figure on record.
The ETF channel split is worth a second look. Of the $1.48 trillion in 2025 ETF inflows, passive ETFs alone absorbed $638 billion, or 43% of the total. Equity ETFs as a category captured 63% of all ETF inflows. The dominance of low-cost vehicles within ETF flows mirrors what’s happening at the wrapper level: investors aren’t just moving from mutual funds to ETFs, they’re moving from active-management economics to passive-tracking economics regardless of wrapper.
At the asset-manager level, the directional pattern is consistent across reporting periods: the three largest index-fund houses — Vanguard, BlackRock’s iShares franchise, and Schwab — absorbed the bulk of passive inflows, while legacy active shops like T. Rowe Price, Franklin Templeton, and Capital Group continued to bleed AUM from their traditional equity mutual fund lines. The crossover moment — passive surpassing active in total AUM — was driven by sustained net rotation of new capital toward the index-tracking model, not by market returns alone.
How Active vs Passive Funds Compare on Fees, Tax, and Performance
Three structural forces explain why money keeps flowing in one direction: fee drag, tax efficiency, and the simple math of beating a hyper-competitive benchmark net of costs.
Fee drag: 0.74% versus 0.15%
The Investment Company Institute’s March 2026 fees report puts the 2025 asset-weighted average expense ratio for actively managed domestic equity mutual funds at 0.74%. The equivalent figure for index domestic equity mutual funds is 0.15%, and equity index ETFs come in slightly cheaper at 0.14%. That’s a 59-basis-point spread, compounded annually, for 30 or 40 years.
Run the dollar math: start with $100,000 plus $500 per month in contributions, 30 years, 8% gross annual return. The passive portfolio at a 0.15% expense ratio ends at $1.65 million. The active portfolio at 0.74% — same gross return, same contributions — ends at $1.43 million. A $218,000 gap, paid entirely to active managers in fees, in exchange for net performance that statistically lags the index over the same window. That gap widens further once you account for tax drag.
Tax inefficiency: the December surprise
Active mutual funds distribute realized capital gains to shareholders every December — even if the shareholder didn’t sell a single share that year. Buying decisions made by the fund manager become tax events on your 1099. ETFs use the in-kind creation and redemption mechanism to defer virtually all capital gains, which is why the wrapper itself matters as much as the strategy. We covered the tax math in detail in our ETFs vs Mutual Funds 2026 breakdown, but the short version: holding active mutual funds in a taxable account adds another layer of cost — the year-end capital gains distributions create a tax bill even in years when you didn’t sell a share. In tax-advantaged accounts (401(k), IRA), this layer disappears; in taxable accounts, it’s the single most expensive thing about owning active.
The hurdle nobody talks about
For an active manager to deliver index-equivalent returns to a shareholder, they need to outperform the benchmark by their net expense ratio plus any tax distributions. The market is reasonably efficient, the manager population is roughly normally distributed around the index gross of fees, and the fees are extracted before the investor sees the result. The math is brutal.
SPIVA’s Verdict: The Referee’s Scorecard
S&P Dow Jones Indices has published its SPIVA (S&P Indices Versus Active) scorecard since 2002, making it the longest-running independent measurement of active manager performance against the benchmarks active managers explicitly try to beat. Year-End 2025 is the 24th full edition, and it lands brutally one-sided for active.
In 2025, 79% of all US large-cap active equity funds underperformed the S&P 500. That’s worse than 2024’s 65%, and the fourth-worst year for active large-cap managers in the scorecard’s 25-year history. Over the trailing 10-year window, more than 80% of US equity funds underperformed their benchmarks net of fees. The longer the horizon, the higher that percentage climbs.
The 2025 data has one striking exception: US small-cap active funds had their best year on record. Only 29.7% of active managers underperformed the S&P SmallCap 600 — meaning 70.3% beat the index. That’s the highest active win rate ever recorded in SPIVA US small-cap data. Small-cap remains a segment with genuine information asymmetries: thinner analyst coverage, less efficient pricing, and reward for fundamental research that doesn’t translate to large-cap equity, where every disclosure is parsed by hundreds of professional analysts within seconds.
The Morningstar Active/Passive Barometer triangulates the SPIVA data from a different angle. Over the 12 months ending June 2025, only 33% of active funds beat their average index counterpart in their category.
The persistence problem
The natural defense of active management runs: yes, most managers underperform, but some are genuinely skilled — the trick is identifying them in advance. SPIVA’s Year-End 2025 Persistence Scorecard demolishes this defense. Of the 164 US large-cap funds that ranked in the top quartile of returns in 2021, only 4.5% remained in the top quartile through 2025. Even more striking: by 2023 — just two years after the cohort was identified — 0.0% of the original top-quartile cohort were still top-quartile. That’s not “skill is rare.” That’s “skill, as measured by short-term returns, is statistically indistinguishable from luck.”
Worth noting: passive index funds are themselves a form of quantitative, rules-based investing — algorithmic rebalancing to track an index. The active vs passive funds framing somewhat obscures the fact that the winning strategy is, in fact, a quant strategy. It’s just the simplest possible one: hold everything in market-cap weight, rebalance mechanically, charge nothing.
Where Active Still Earns Its Keep
The SPIVA narrative is not “active is dead.” It’s “active loses on average and badly in efficient markets — but the average obscures genuine pockets where selectivity matters.” Four segments stand out.
US small-cap and micro-cap. 2025 was the high-water mark for active small-cap, but even the 10-year SPIVA data shows a higher active win rate in small-cap than large-cap. Smaller companies have thinner Wall Street coverage — fewer analysts per name, slower information diffusion, and more dispersion in fundamentals — which creates the inefficiency active management needs to extract value.
Emerging markets and frontier markets. Local-knowledge premiums, currency dynamics, and capital-control friction make these markets less efficient than developed peers. Active managers with on-the-ground research operations have a structural edge — though SPIVA’s emerging markets scorecard still shows the majority of active EM funds underperforming over longer windows.
Fixed income, especially high-yield and emerging market debt. SPIVA’s fixed income scorecards consistently show higher active win rates in non-investment-grade credit than in equity. Issuer selection, credit research, and covenant analysis carry weight that mechanical index tracking can’t replicate. The investment-grade and Treasury portions of the bond market behave more like equity — active loses to cheap index tracking — but high-yield and EMD are different animals.
Liquid alternatives and managed futures. These strategies don’t track a public benchmark by design, so the SPIVA framework doesn’t really apply. They’re sold on absolute-return or low-correlation grounds, and the value proposition is portfolio diversification rather than benchmark outperformance. Whether they earn their fees is a separate question.
One additional niche worth flagging: actively managed thematic ETFs. We covered the YieldMax / JEPI / Roundhill ecosystem in our breakdown of weekly and monthly dividend ETFs. These are active wrappers that aren’t trying to beat a benchmark — they’re trying to deliver a specific income or volatility profile. Like managed futures, they’re sold on outcome, not alpha.
What This Means for Your Portfolio
The data implies a clear default architecture, with deliberate exceptions for the segments where active actually earns its fee.
For core US large-cap equity allocation, passive is the default. A broad market index fund or ETF (VOO, VTI, ITOT, FSKAX, SCHB — pick by expense ratio and tax-advantaged-vs-taxable account) covers it. There’s no defensible reason to pay 0.74% per year for active US large-cap exposure when 79% of those funds underperformed the index this year and the persistence data says you can’t pre-identify the 21% that won’t. We walked through the broader portfolio math in our 60/40 portfolio in 2026 breakdown.
For satellite positions where you have a specific thesis — small-cap, EM, fixed income alpha, alternatives — active can be defensible if the cost is reasonable and the strategy is repeatable. The mistake is using active as a default rather than a thesis-driven exception.
If you currently hold active mutual funds in a taxable account, two things to know. First, the year-end capital gains distribution is a known tax cost; the December distribution announcement is published in advance on each fund’s site, so you can plan for it. Second, switching to an index ETF inside a taxable account creates its own capital gains event — for funds with significant unrealized gains, the switch itself triggers tax, which can take years to recoup through the fee savings. Run the math before swapping. In tax-advantaged accounts (401(k), Roth IRA, traditional IRA), this concern disappears — switching is free, and the fee savings compound immediately.
Bottom Line
The active vs passive funds debate is over in flows, in AUM, in performance scorecards, and in the structural math of fees and taxes. Passive surpassed active in 2024, the gap is widening, and the SPIVA data shows the gap isn’t an artifact of one bad year. Active still earns its keep in genuine inefficiencies — small-cap, EM, high-yield credit, defined-outcome wrappers — but as a default for core US equity, the case has collapsed. The reader’s job isn’t to relitigate the choice. It’s to match the exception to the portfolio.
Get early access to Orbit
Orbit is Luna3.ai’s AI-augmented research engine. 12 algorithmic signals + a gradient-boosted ML model + an agentic LLM that reads each top pick’s filings and writes a daily thesis with conviction score and catalyst proximity. Three regimes, three playbooks — growth in expansion, defensives in late-cycle, recovery plays at panic bottoms. The 3 in Luna3.ai.
No spam. Unsubscribe any time.
No comments yet. Be the first to share your thoughts!