- Over the actual 20-year window (Nov 2006 – May 2026), growth ETFs decisively beat dividend ETFs on CAGR — VUG returned roughly 13.2% per year vs VYM's 9.2%. A $100 stake became $1,107 in VUG, $559 in VYM.
- SCHD's quality screen does NOT close the CAGR gap with VUG — it lagged VUG by ~4 percentage points per year (13.1% vs 17.2%) even in the modern decade (Oct 2011-May 2026). What SCHD did deliver is materially lower volatility (14% vs 22% annualised) and a slightly shallower drawdown. The case for SCHD is risk-adjusted, not return-equivalent.
- The real driver isn't returns — it's tax wrapper plus life stage. Growth ETFs win in taxable accounts during accumulation. Dividend ETFs win in tax-advantaged drawdown. The 'which wins?' question only makes sense once you've nailed those two variables down.
The dividend vs growth ETFs debate refuses to die on Reddit. Open r/ETFs or r/Bogleheads on any given week in 2026 and someone is asking whether SCHD or VUG wins over the long haul — usually with a “20 years” qualifier and a vague sense that one of them is “the right answer.” It isn’t. The framing is wrong, and the numbers we ran for this piece tell a more interesting story than the threads ever do.
Schwab’s quality-screened dividend ETF — ticker SCHD — last printed $31.62 going into publication on May 18, 2026, and is up roughly 24% in the trailing twelve months. That recent run-up is what brought the question back to the top of the subs. But the answer depends on two variables most posters skip: which dividend ETF you actually mean, and what tax wrapper you’re holding it in.
Why “dividend vs growth ETFs” is the wrong question
Picking sides between dividend and growth as if they were contestants is the same mistake as picking between a hammer and a screwdriver. They do different jobs. Growth ETFs compound capital tax-efficiently in the accumulation phase. Dividend ETFs spin off cash flow without forcing you to sell principal. Once you frame them as tools, the question reduces to: which tool fits your tax situation and your life stage?
The reason the Reddit framing persists is that it’s easy to compare two CAGR numbers and declare a winner. It’s much harder to factor in the qualified-dividend tax bracket you’ll be sitting in for the next 30 years, the sequence in which returns arrive relative to when you start drawing down, and whether your account is taxable or tax-advantaged. Those three variables — not the headline return — determine which one “wins” for you.
What “dividend ETF” actually means (it’s not what most retail thinks)
“Dividend ETF” is a category, not a strategy. Two products in that category — SCHD and VYM — produce dramatically different results because their underlying indexes screen for different things.
SCHD tracks the Dow Jones US Dividend 100 Index. The methodology is unusually demanding: companies must have paid dividends for at least 10 consecutive years, and the remaining universe is then ranked by a composite score of cash-flow-to-debt ratio, return on equity, dividend yield, and five-year dividend growth rate. Only the top 100 by composite score make the cut. The result is a portfolio of profitable, low-leverage, dividend-growing companies — not just high-yielders.
VYM tracks the FTSE High Dividend Yield Index. The screen is simpler: roughly 440 large-cap US companies ranked by forecast dividend yield, with a tilt toward consumer, energy, and industrials. There’s no quality overlay — a stock with a 6% yield because the share price collapsed and the dividend hasn’t been cut yet can sit in VYM. SCHD’s quality screen would eject it.
This matters more than retail discourse acknowledges. When people on r/dividends say “SCHD beats the market,” they are usually citing SCHD’s full performance history — but SCHD only launched on October 20, 2011. It has never lived through a true bear market plus recovery cycle the way VYM has (which has data back to November 2006). Different ETFs, different data windows, different conclusions.
What “growth ETF” actually means
On the growth side, two products dominate retail flows: VUG (Vanguard Growth ETF) and QQQ (Invesco QQQ Trust, NASDAQ-100). They are not the same thing.
VUG tracks the CRSP US Large Cap Growth Index — roughly 200 large-cap US stocks screened on six growth factors including earnings growth, sales growth, and return on assets. It’s diversified across sectors and includes growth names from tech, healthcare, consumer discretionary, and financials. QQQ, by contrast, is the largest 100 non-financial stocks on the NASDAQ exchange — a listing screen, not a growth screen. The result is QQQ runs hotter (more tech concentration, higher volatility) but reads the same when people loosely say “growth ETF.”
For the 20-year math below we use VUG because it has nearly two full decades of data (inception January 26, 2004) and represents the diversified growth exposure most retail allocators actually want. QQQ has a longer history but is closer to a sector bet than a growth-style ETF.
The actual 20-year math (2006-11 to 2026-05)
Here is what $100 invested in each ETF on November 10, 2006 (VYM’s inception, the limiting date for a fair comparison) would have become by mid-May 2026, with dividends reinvested:
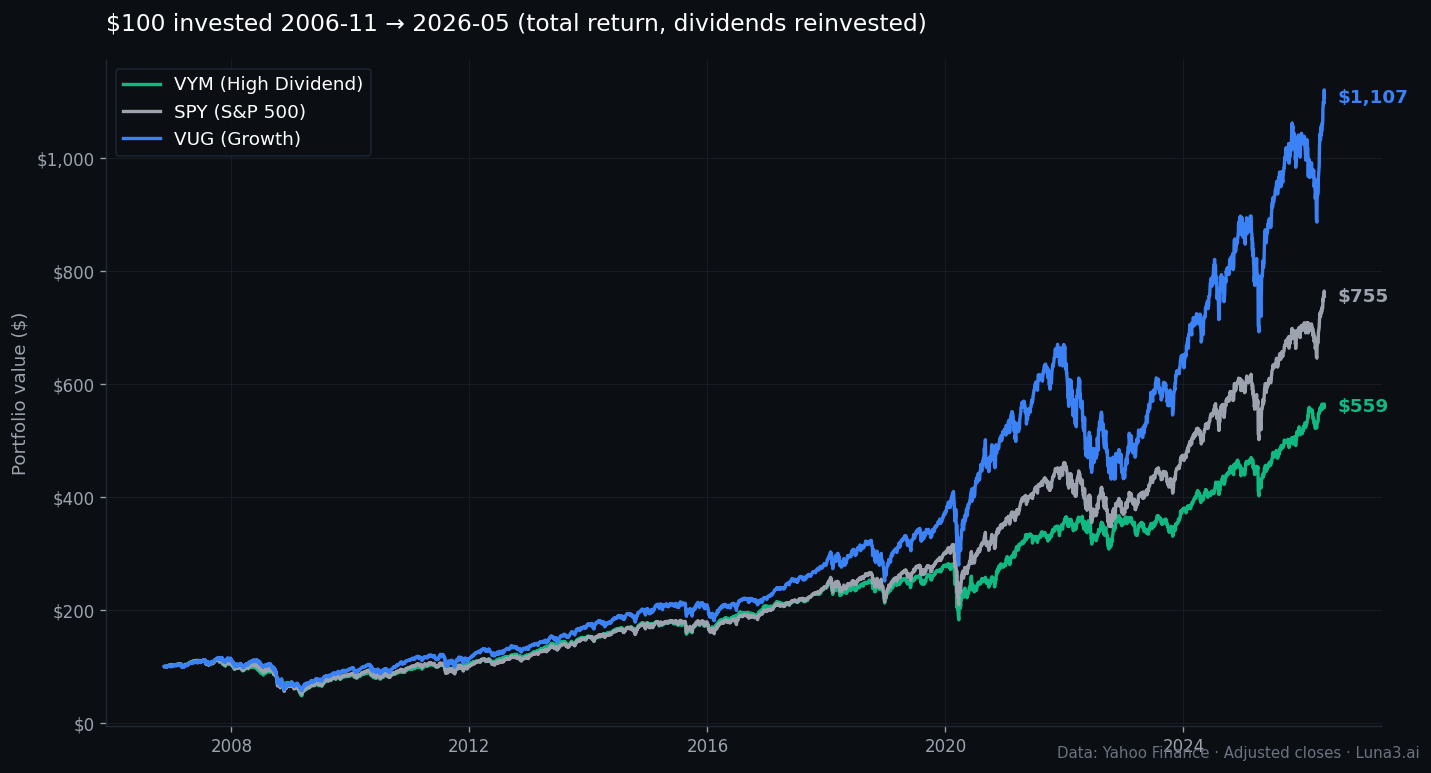
The headline numbers, in plain English:
- VUG — 13.2% annualised return, $100 → ~$1,107. Max drawdown along the way: -51% during the 2008-2009 financial crisis.
- VYM — 9.2% annualised return, $100 → ~$559. Max drawdown: -57% in 2008-2009.
- SPY (the S&P 500 benchmark, listed for context) — 11.0% annualised, $100 → ~$755. Max drawdown: -55%.
That is a four-percentage-point CAGR gap between VUG and VYM. Compounded over 19.5 years, it is the difference between $559 and $1,107 — your terminal wealth nearly doubles by sitting in growth rather than broad high-yield. If the discussion ended here, the verdict would be obvious: growth wins decisively.
It doesn’t end there. The “dividend ETF” most retail investors actually mean isn’t VYM — it’s SCHD. And SCHD changes the answer.
The SCHD plot twist — quality changes the picture
SCHD only has 14.6 years of history (since October 2011), so a true 20-year comparison is impossible. But over the modern decade — the entire SCHD window from late 2011 to today — the numbers reveal a more nuanced story than the Reddit narrative claims:
- VUG (Oct 2011 – May 2026): ~17.2% CAGR, max drawdown -36% (during the 2022 bear market).
- SCHD (Oct 2011 – May 2026): ~13.1% CAGR, max drawdown -33%.
SCHD’s CAGR trailed VUG’s by roughly four percentage points per year — almost exactly the same 4pp gap that exists between VUG and VYM over the full 20-year window. So the popular “SCHD has matched growth-ETF returns” framing on Reddit doesn’t survive contact with the data. What SCHD did deliver is a meaningfully lower volatility profile: annualised 5-year volatility of 14% versus VUG’s 22%, with a slightly shallower maximum drawdown. That is a real and defensible advantage — but it is a risk-adjusted advantage, not a return-equivalent one.
The honest caveat: even SCHD’s 14-year window starts at the bottom of the 2011 European debt crisis and runs through one of the longest bull markets in US history, interrupted only by short and shallow drawdowns. Whether SCHD’s volatility advantage holds up through a true generational downturn — the kind VYM lived through in 2008-2009 — is unknowable. The quality methodology is robust on paper. The track record is short on calendar.
The hidden variable — tax drag in taxable accounts
Pre-tax CAGR is the bait. After-tax return is the metric. And here the Bogleheads explainers tend to skip the math, so let’s run it.
Dividends paid out by an ETF in a taxable account are taxable in the year they are paid, even if you immediately reinvest them. For 2026, qualified dividend tax rates are 0%, 15%, or 20%, depending on filing status and taxable income — most retail investors in the accumulation phase sit at 15%. There is also a 3.8% net investment income tax surcharge for higher earners.
At current yields, the implied annual tax drag in a 15%-bracket taxable account looks like this:
- VUG (yield ~0.4%) × 15% = roughly 0.06% annual tax drag. Near-trivial.
- VYM (yield ~2.2%) × 15% = roughly 0.33% annual tax drag.
- SCHD (yield ~3.3%) × 15% = roughly 0.50% annual tax drag.
That gap may look small on a single-year basis. Compounded over 30 years, a 0.4-percentage-point drag steals roughly 11-12% of terminal wealth. On a $500,000 nest egg, that is $55,000+ of compounding lost to the tax man — and that’s before we add state income tax, which in high-tax states like California (13.3%) can nearly double the federal drag.
Growth ETFs sidestep this almost entirely. Unrealised capital gains compound tax-free until you sell. You control the timing — you decide which tax year to recognise the gain in, you can step up the basis at death, and you can offset gains with realised losses through tax-loss harvesting. That control is worth real money over a 30-year horizon.
Sequence-of-returns risk — the lost decade flip
“20-year total return” is the wrong question if you are drawing down. The order in which returns arrive matters at least as much as the average.
Consider the 2000-2010 “lost decade” for US growth equity. The NASDAQ-100 fell roughly 78% from its March 2000 closing high to its October 2002 trough and did not retake those highs until August 2016 — sixteen years of effective zero return at the index level. A retiree who started drawing 4% per year out of a NASDAQ-100-style portfolio in 2000 ran out of money long before recovery arrived. The same retiree drawing 4% out of a high-dividend portfolio kept receiving cash flow that didn’t require selling depressed shares.
Now flip the start date. The same retiree starting drawdown in 2009 with a NASDAQ-heavy portfolio rode one of the strongest 15-year runs in equity-market history and ended up with more money than they started with. Same strategy, opposite outcomes — purely because of when they showed up.
The implication: if you are 20+ years from drawdown, sequence risk is your friend and growth is the better tool because volatility just means you buy more shares at lower prices on the way up. If you are within 5 years of drawdown or already drawing, sequence risk is your enemy and dividend cash flow is the insurance policy.
How a systematic investor actually models this decision
The retail framing of dividend vs growth ETFs is a return-maximisation problem: which one has the higher CAGR? A systematic investor frames it as a constrained optimisation problem: maximise after-tax compound return subject to a sequence-risk constraint, an account-type constraint, and a withdrawal-rate constraint. The framing change is the entire game.
What this looks like in practice: a quant running a long-horizon retail portfolio models projected wealth at retirement as a function of pre-tax CAGR minus tax drag, minus expense ratio, minus implementation slippage. For a 30-year accumulation phase, growth ETFs in a taxable account dominate because the after-tax compound is what funds retirement — not the headline return. For a 5-year window into drawdown, that calculus inverts: a 50% drawdown on a 90%-stock portfolio at year 28 destroys more wealth than 30 years of tax drag ever could. The optimal allocation slides from 100% growth in early years toward a dividend-tilted blend in the glide path, and the cut-over isn’t a date — it’s a function of portfolio size relative to projected spending.
The same logic explains why target-date funds — the closest thing retail has to a systematic glide path — never sit at 100% in either dividend or growth ETFs at any age. They blend, and the blend slides. Most retail dividend vs growth debates are arguing for a degenerate corner of the optimisation surface that no quantitative framework would actually pick.
The decision framework for dividend vs growth ETFs
Strip away the Reddit narrative and the actual decision matrix is straightforward:
| Tax wrapper | Life stage | Best tool | Why |
|---|---|---|---|
| Taxable | Accumulating · 20+ yrs out | Growth (VUG) | Unrealised cap-gains compound tax-free. Sequence risk is a feature, not a bug. |
| Taxable | Within 5 yrs of drawdown | Mix · ~60/40 VUG / SCHD | Cash flow buffer plus continued capital gains harvesting via tax-loss pairing. |
| Tax-advantaged (IRA · 401k · Roth) | Accumulating | VUG or SCHD | No tax drag advantage to either side. Pick on return profile and volatility tolerance. |
| Tax-advantaged | Drawdown / income | Dividend (SCHD or VYM) | Cash flow without forced selling. Quality screen (SCHD) preferred to broad yield (VYM). |
One nuance worth flagging: in a Roth IRA — where withdrawals in retirement are tax-free — there is no after-tax case for dividends over growth. The “cash flow without selling” argument still applies, but in a tax-free wrapper you can rebalance into cash-flow-producing assets at any time without a tax bill. Hold growth until retirement, then convert at zero tax cost. That’s a structural advantage Roth holders should not give up by defaulting to dividend ETFs.
The Bottom Line
Over the actual 20-year window we can measure, VUG decisively beat VYM on raw CAGR — by roughly four percentage points per year, which compounds to nearly double the terminal wealth. That is the honest answer to “growth vs dividend, who wins over 20 years?” if you have to give one number.
The more useful answer is that SCHD’s quality screen has bought retail investors a meaningfully smoother ride — lower volatility, slightly shallower drawdowns — but it has not closed the CAGR gap with VUG. SCHD trailed VUG by 4pp annually even in the modern decade, the same gap that has separated dividend from growth across the full 20-year window. The case for SCHD is risk-adjusted, not return-equivalent. And none of it matters much if you are in the wrong tax wrapper or the wrong life stage for the tool you are holding.
Stop framing this as a contest. Pick by tax wrapper plus life stage, and pick the specific ETF whose underlying index methodology you actually understand. The retail Reddit war is louder than the data; the data prefers a portfolio decision over a tribal one.
For a deeper read on related Vanguard ETF choices, see our breakdown of VOO vs VTI for the broad-market core, and on the cost side, why expense ratios compound over decades. Both pair naturally with this decision matrix once you’ve settled the dividend vs growth question.
Get early access to Orbit
Orbit is Luna3.ai’s AI-augmented research engine. 12 algorithmic signals + a gradient-boosted ML model + an agentic LLM that reads each top pick’s filings and writes a daily thesis with conviction score and catalyst proximity. Three regimes, three playbooks — growth in expansion, defensives in late-cycle, recovery plays at panic bottoms. The 3 in Luna3.ai.
No spam. Unsubscribe any time.
No comments yet. Be the first to share your thoughts!