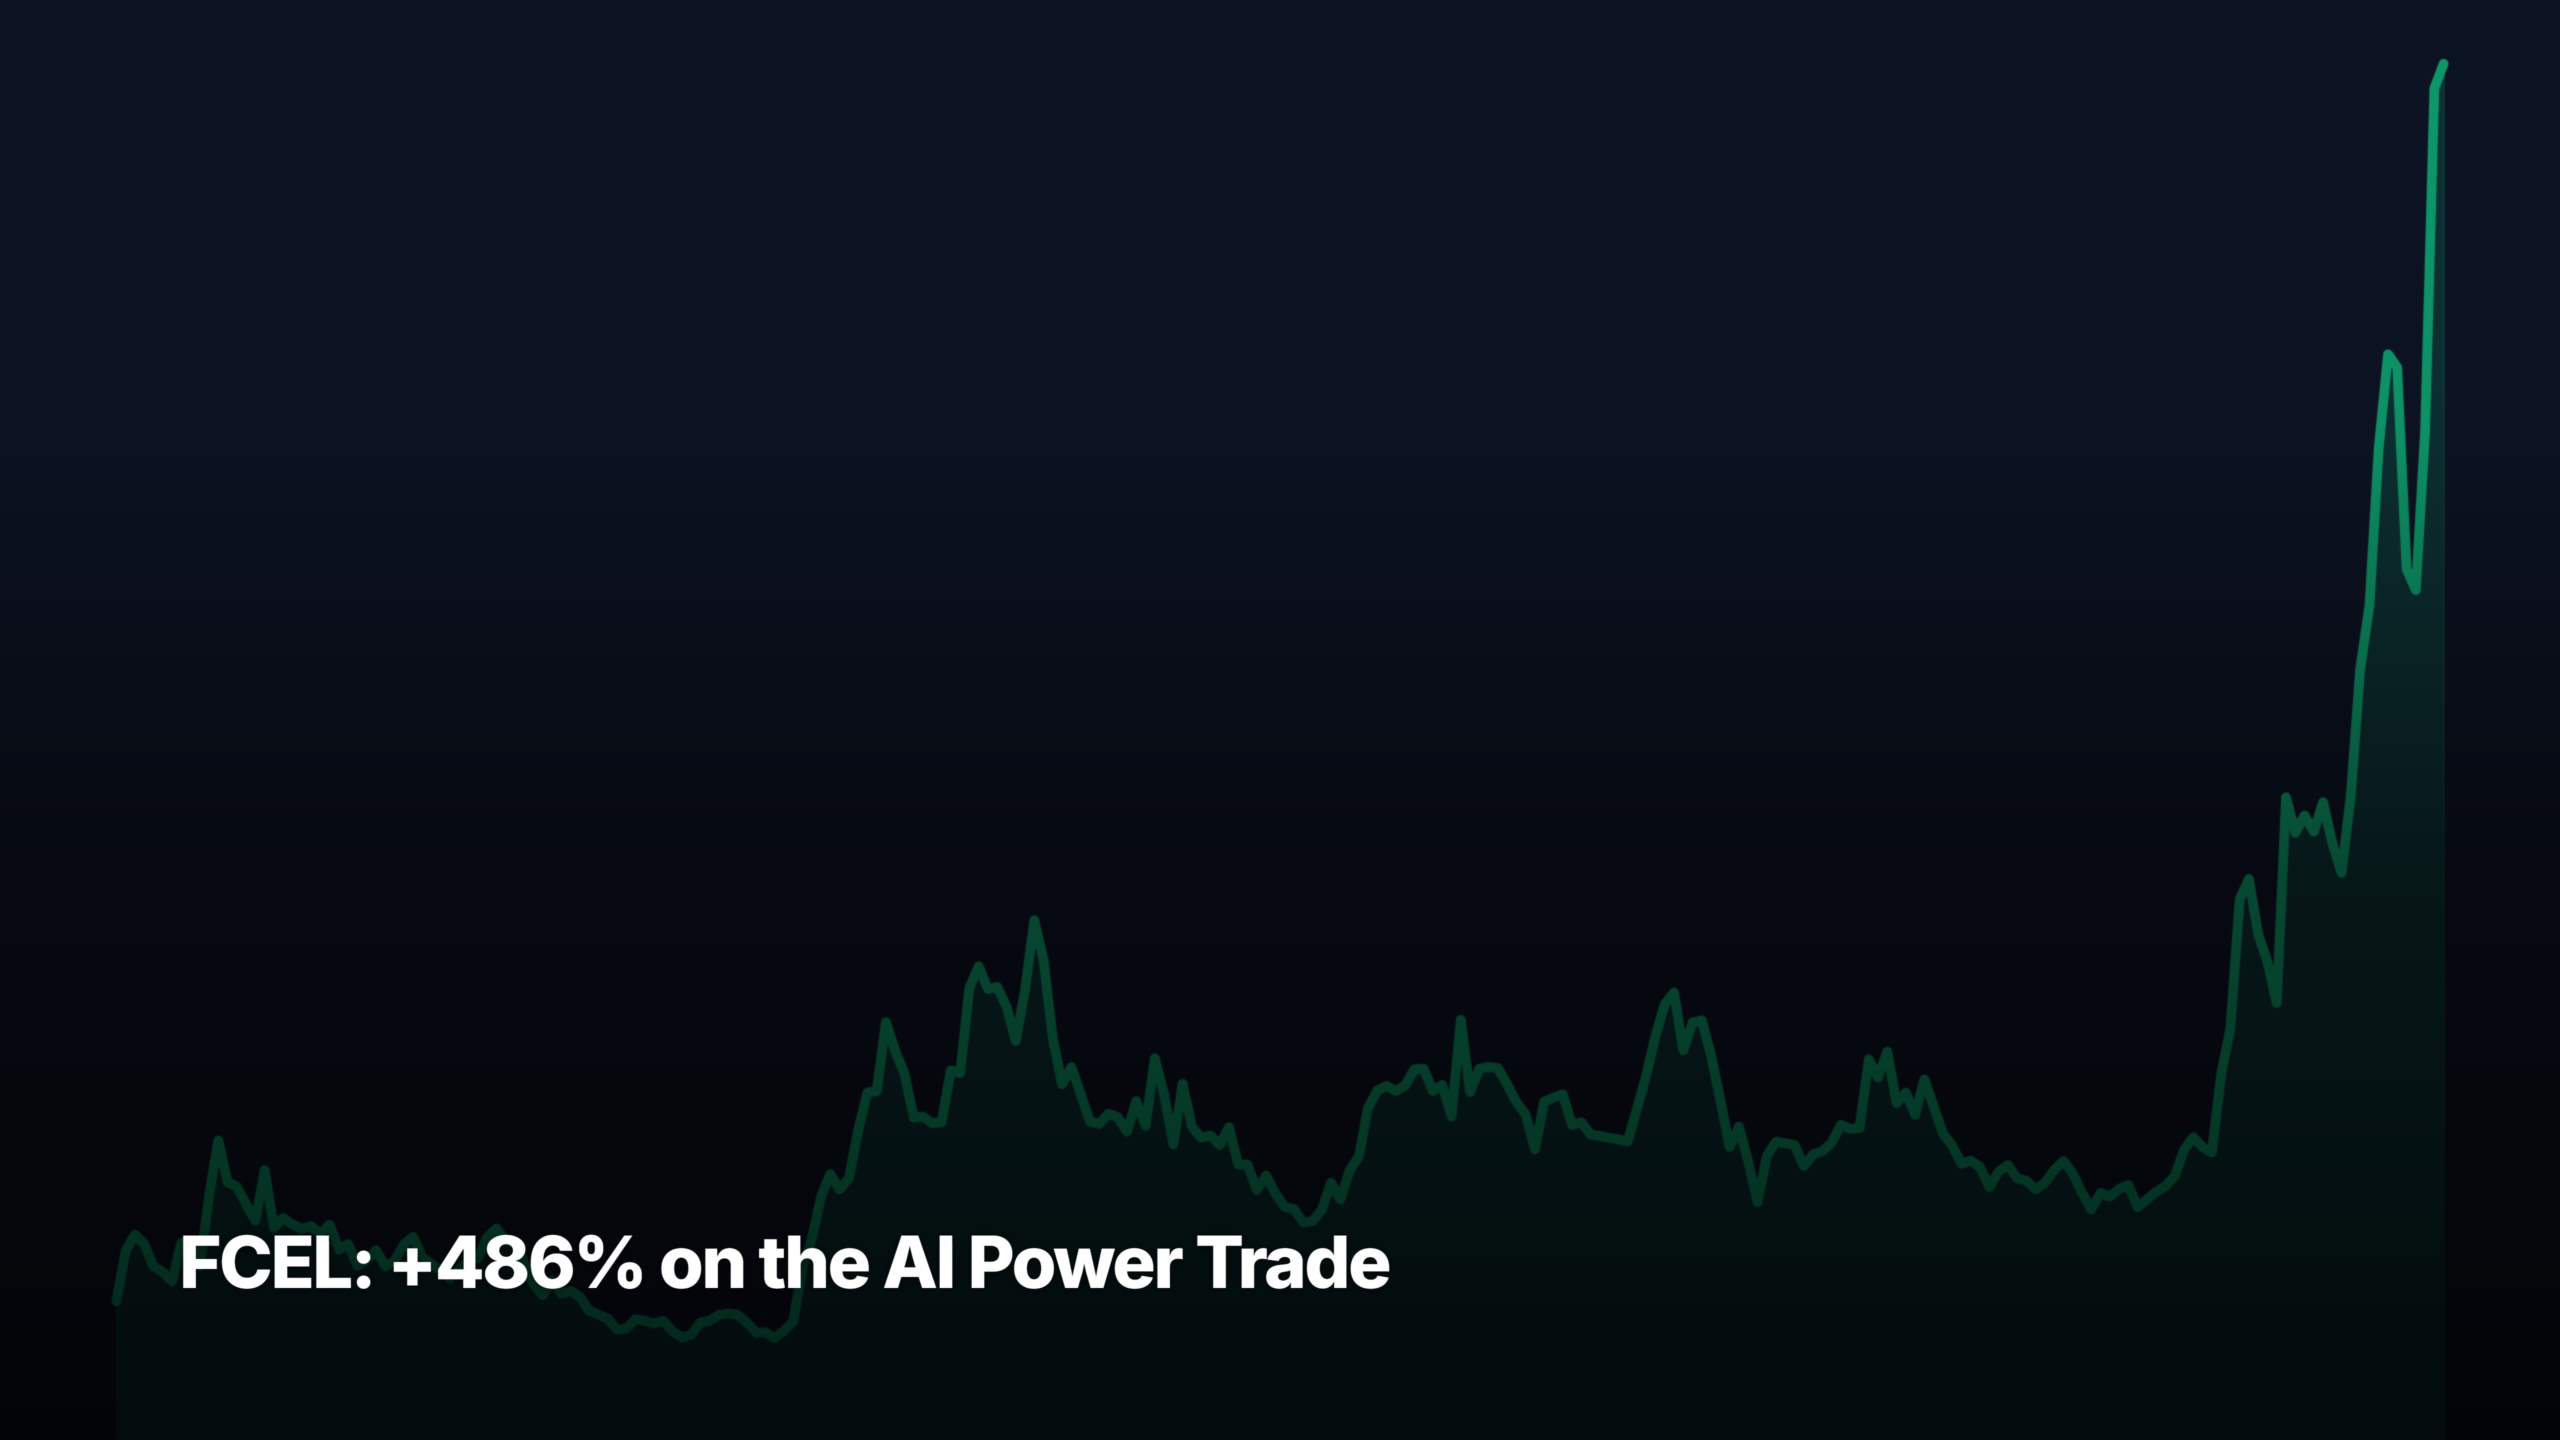
- FCEL stock closed Friday May 22 at $26.85, finishing its eighth consecutive green week and setting a new 52-week high of $27.33 intraday.
- The March 23 launch of FuelCell Energy's 12.5 MW Power Block — a packaged, utility-grade fuel-cell unit aimed directly at AI data centers — put the company inside the same AI-power thematic lifting GE Vernova's gas turbines, nuclear SMR names, and the rest of the hydrogen complex.
- The move is a cap-tier story: at a $1.42 billion market cap, FCEL is the small-cap leader of a sector where Bloom Energy (BE, $89.9B) is providing absolute dollar flow and Ballard (BLDP, $1.74B) is the percentage-move peer.
FCEL stock just closed Friday at $26.85, set a fresh 52-week intraday high of $27.33, and finished its eighth straight green weekly close — a run that has lifted FuelCell Energy from $4.58 a share twelve months ago to a fully diluted market cap of $1.42 billion. The trailing twelve-month return is +486%. This piece reads the tape on that move, not the prospectus: where the catalyst actually came from, what the algo pattern looks like to a momentum book, how FCEL stacks against its hydrogen-complex peers, and where this could break.
The stock — ticker FCEL — last printed $26.85 going into publication on May 23, 2026, and is up roughly 486% in the trailing twelve months. That kind of vertical move on a $1.4 billion small-cap is what gets algorithmic momentum books to assemble fresh positions. It is also what makes the next two weekly closes interesting: continuation looks one way on the tape, exhaustion looks another.
How FCEL Stock Moved Through the Cap Tiers
The twelve-month price ladder is the cleanest way to see the rip. A year ago, on May 22, 2025, FCEL closed at $4.58. By August 20, 2025 it had touched the 52-week low of $3.78 — well inside microcap territory at roughly a $200 million market cap. The stock then spent eight months consolidating in the $5–$8 range before its breakout began.
The break itself unfolded over six trading sessions in mid-May 2026:
- May 13: +16.6% to $19.92 close — first session above $19, on 17.6 million shares.
- May 14: +8.4% to $21.60 close — first session above $20.
- May 15: -1.1% to $21.36 — consolidation hold.
- May 18 (Monday): down 22.7% from prior close intraday, touching $16.51, before closing $17.74 (-16.9% on the session). The slide came on broad hydrogen-sector profit-taking — Plug Power touched -12.2% intraday the same day before recovering to close -8.7%.
- May 19: -2.1% follow-on to $17.36.
- May 20: +16.5% rebound to $20.22 as hydrogen-complex flows rotated back in.
- May 21: +30.5% to $26.38 — biggest single-day gain of the entire 12-month run. Intraday range $19.74 to $26.90. Coincided with the John Livingston board appointment announcement.
- May 22: +1.8% to $26.85, with the intraday high of $27.33 marking a new 52-week high.
At roughly 53 million shares outstanding, the May 22 close puts FCEL at a $1.42 billion market cap — solidly small-cap on the threshold of mid (Luna3’s framework treats $2 billion as the small-to-mid boundary). The twelve-month ladder is therefore $4.58 → $26.85, a 5.86× multiple, or +486%. A year ago this stock screened as a microcap retail vehicle; today it screens as a small-cap thematic leader.
The cap-tier framing matters because it determines the readership. The same +486% move at mega-cap size would attract a different investor base — sovereign wealth funds, index-replication buyers, long-only large-cap institutions. At $1.4 billion, FCEL trades inside the algorithmic momentum-book layer: trend-following funds, sector rotators, retail momentum traders, and the small-cap value managers who screen for relative-strength outliers. Each cohort behaves differently on a pullback, which matters for the risk section below.
The 12.5 MW Power Block Catalyst — What Actually Launched
The trigger event happened two months before the breakout. On March 23, 2026, the company’s announcement introduced the FuelCell Energy Block — a standardised, packaged 12.5 MW utility-grade power solution targeted directly at data centers. The architecture is five independently operating 2.5 MW fuel cell systems sharing balance-of-plant infrastructure, sized so operators can add capacity in 12.5 MW increments or aggregate multiple blocks for a single campus. FuelCell simultaneously announced manufacturing expansion plans to scale production, and highlighted the offering at DCD>Connect New York the following day.
The product solves a specific bottleneck. Data centers need 24/7 baseload power, but grid interconnects in the United States now run 3–4 years in data-center-heavy zones — and the total application-to-operation timeline has climbed from under two years in 2008 to over eight years today, per grid-queue analysis published in Utility Dive. Hyperscalers building today cannot wait. On-site generation — gas turbines, nuclear small modular reactors, fuel cells, behind-the-meter solar-plus-storage — has become the rate-limiter on AI capex deployment. Fuel cells fit a particular slot in that stack: slower to scale than gas turbines, but cleaner, modular, and faster to permit than nuclear.
The competitive frame is direct. FCEL is now pitching its 12.5 MW Block against GE Vernova’s gas turbines (the dominant on-site option today, but with multi-year backlogs through 2028) and the wave of SMR nuclear bets (which won’t ship commercial product for several more years). Bloom Energy already sells a competing solid-oxide fuel-cell product to data centers, which is why the rotation has lifted BE as well as FCEL.
The delayed price reaction is itself worth flagging. The March 23 announcement landed during four weeks of choppy consolidation — the weeks of March 30 and April 6 closed +1.1% and +0.8% respectively. The market took until April 13 to start pricing the news in earnest, when FCEL posted its first meaningful weekly gain of +9.0%. That kind of slow-burn re-rating is a hallmark of small-caps whose catalysts get absorbed by index funds, sector ETFs, and momentum books over weeks, not hours. The big announcement-day pop you might expect on a mega-cap doesn’t happen the same way at $7 a share.
A second smaller catalyst landed on top of the rally. Per the May 19 8-K filing, John Livingston joined the board of directors effective May 19 and was placed on the Audit and Compensation committees. The board expanded from eight to nine members. Livingston is a cybersecurity entrepreneur (former CEO of Verve Industrial Protection, which Rockwell Automation acquired) and a 20-year McKinsey veteran. The market read the appointment as a credential signal for the data-center pivot — a relevant board addition lands on Thursday, the stock ripped 30.5% the same session.
One caveat that needs to stay visible. The 12.5 MW Power Block is a product launch, not a named customer contract. FCEL has not disclosed a hyperscaler order with a specific named operator. The move reflects expectation that orders are coming, not confirmation that they have. The next earnings report becomes the visibility checkpoint.
Why FCEL Stock Has Been Rising for Eight Straight Weeks — The Algo Pattern
The eight-week green streak is the load-bearing technical fact of this move. Starting the week of March 30, 2026, FCEL has closed each Friday above the prior Friday’s close for eight consecutive weeks. The sequence: +1.1%, +0.8%, +9.0%, +54.2%, +19.1%, +2.9%, +55.9%, +25.7%. Two weeks alone (week of April 20 at +54.2% and week of May 11 at +55.9%) account for the majority of the rally.
To a momentum book, this is the textbook continuation pattern. Higher highs and higher lows on the daily. Volume expanding from a pre-rally average of roughly 1.3 million shares per day (February through early April) to 10–15 million shares per day on the rip weeks — a 10× volume expansion that confirms institutional participation rather than retail-only speculation. The breakout starts from a clean multi-month base in the $5–$8 range, with the trigger being the first weekly close decisively above the base in the week of April 13.
The counter-pattern — what would say “this is exhausted” — has three components. First, a red weekly close on rising volume signals distribution rather than profit-taking. (A red week on falling volume is neutral.) Second, a failed retest of the prior weekly high after a pullback indicates buyers have stepped back. Third, sector-wide reversal — if BE and BLDP roll over together with FCEL, the rotation has broken, not just the single name.
The Monday May 18 -22.7% intraday drop deserves its own dissection. The slide happened on broad hydrogen-sector profit-taking, with no fresh negative company news. The stock recovered its intraday low within two sessions and broke to new highs that Thursday. That kind of failed sell-off often clears weak hands — short-term traders take profits, the float rotates to higher-conviction holders — but it also tells you the daily volatility you’re pricing into the position. Drawdowns of -20% intraday are normal-state for this stock right now, not exceptional.
One number to watch: the 14-day Relative Strength Index, or RSI, measures the magnitude and persistence of recent price changes on a 0–100 scale. Above 70 is conventionally called “overbought.” FCEL’s daily RSI closed at 76.5 on May 21 and 78.2 on May 22 — statistically elevated, but not a reversal signal in isolation. In strong trending moves, RSI can sit above 70 for weeks before mean-reverting. The reversal signal comes from the divergence — RSI rolling over on a higher price high — not from the level itself.
The Hydrogen Complex — Where FCEL Sits Against BE, BLDP, PLUG
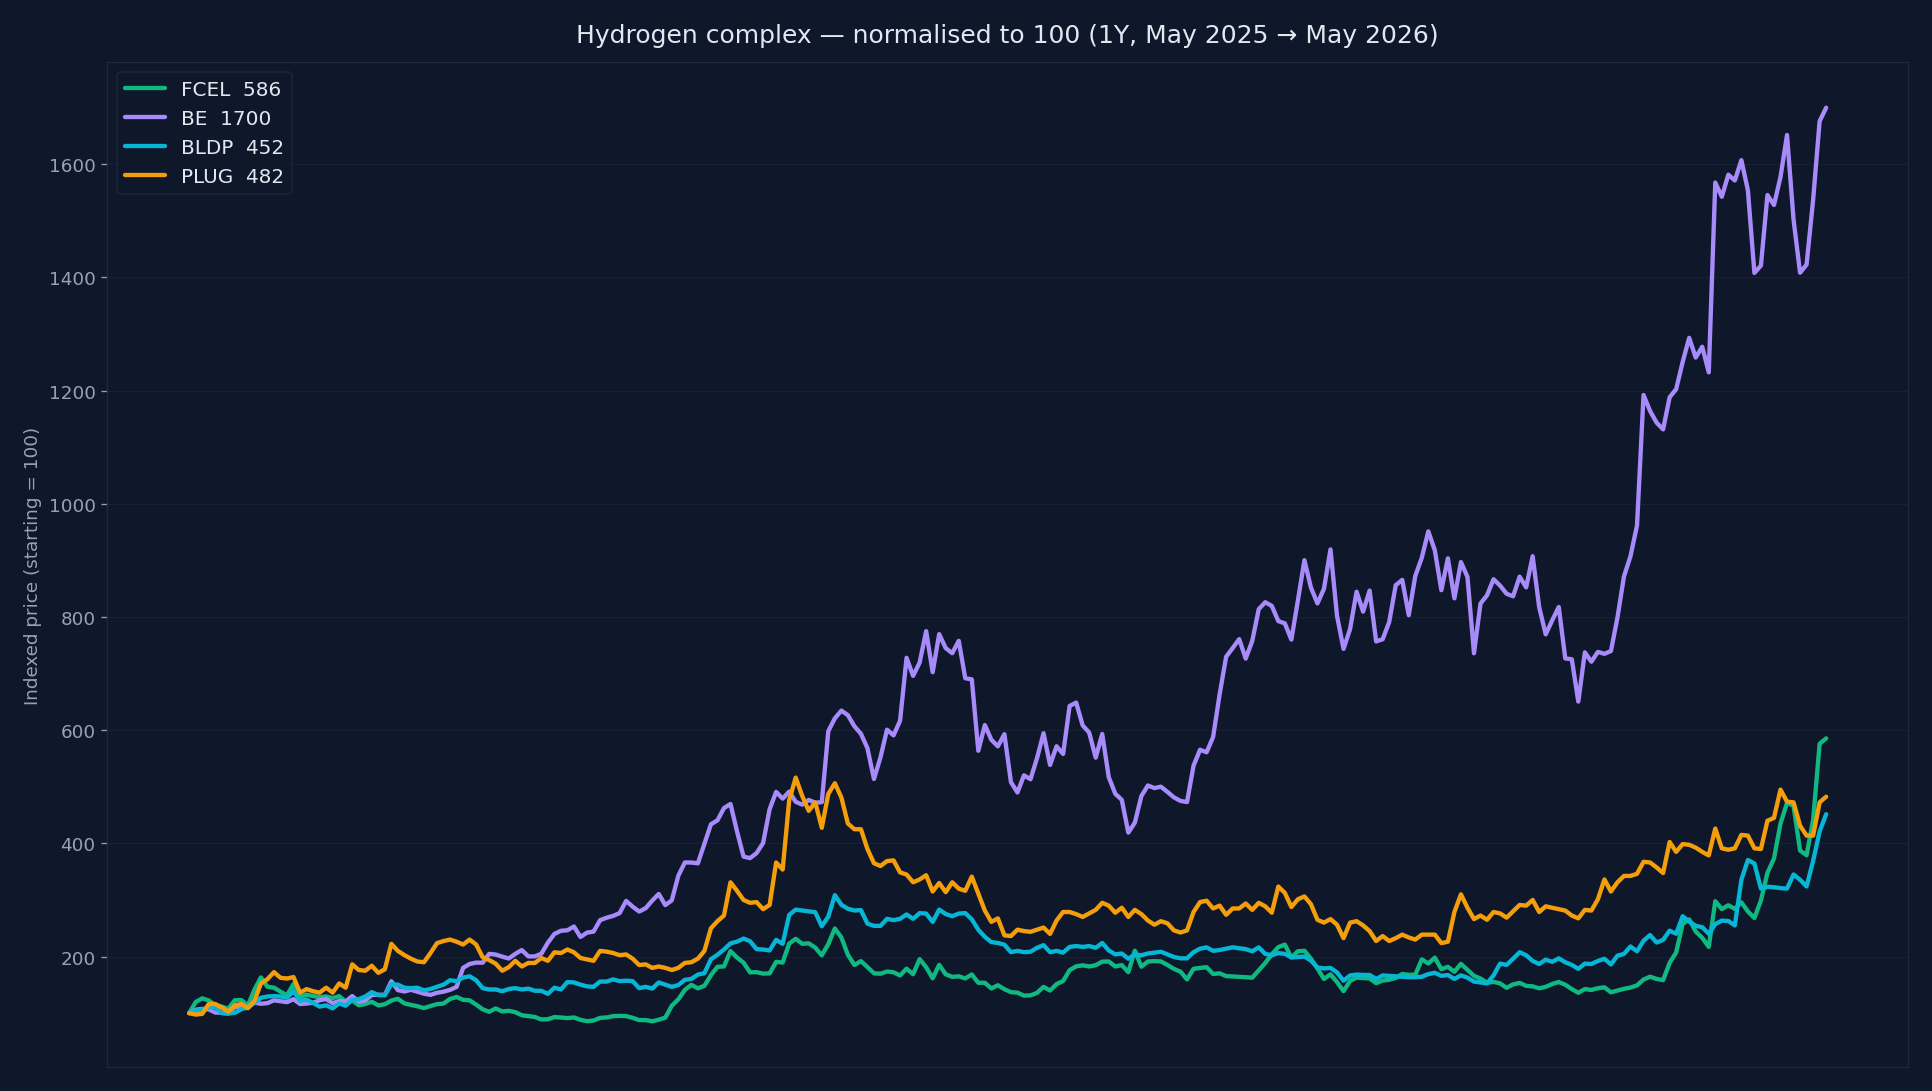
The cohort context is the difference between a thematic rotation and a meme-driven pop. Every pure-play in the hydrogen complex is up over the past month:
| Ticker | Market cap | 1-week return | 1-month return | Cohort read |
|---|---|---|---|---|
| BE (Bloom Energy) | $89.9B | +14.5% | +33.0% | Mega-cap leader — absolute dollar flow |
| PLUG (Plug Power) | $5.38B | +2.1% | +21.3% | Large-cap laggard — dilution overhang |
| FCEL (FuelCell Energy) | $1.42B | +25.7% | +118% | Small-cap leader on percentage terms |
| BLDP (Ballard Power) | $1.74B | +29.4% | +70.3% | Small-cap peer — pure-play fuel cells |
Three reads come straight off the table. First, the cohort is moving as a cohort — not a single stock. That distinguishes the move from idiosyncratic meme-driven action. Second, FCEL has the highest 1-month percentage move (+118%) despite BLDP having the highest 1-week move (+29.4%). The two stocks reflect the same thematic rotation at different timings — FCEL’s catalyst (the 12.5 MW Block launch and the April-May accumulation) sits firmly inside the month-long window; BLDP’s gains have come spread more evenly across the period.
Third — and this is the most useful read — PLUG is the notable laggard. Persistent dilution, recurring operating losses, and a weaker balance sheet make PLUG the favourite hedge-fund short within the hydrogen complex. The fact that PLUG is up only +21% one-month versus FCEL’s +118% tells you the market is being selective: it is rewarding the names with clearer paths to data-center revenue and de-rating the ones still working through legacy operating issues. That selectivity is a positive tell for the rotation thesis. A speculative meme run would lift the worst balance sheet hardest, not slowest.
Where the Money Actually Flows
The dollar trail explaining all of this lives one layer up. Hyperscaler 2026-2027 capex commitments now total more than $300 billion across Microsoft, Meta, Alphabet, and Amazon combined — see our breakdown of the hyperscaler capex math in the DRAM cycle piece. Of that capex, the rate-limiter is no longer GPUs. It is power.
The conversion from capex into spending on individual vendors looks something like this. Step one: hyperscalers commit dollars to new data-center campuses. Step two: each campus needs 100–500 MW of baseload electricity, 24/7. Step three: the grid cannot deliver that on the required timeline — interconnect queues in PJM, ERCOT, and CAISO are 4–7 years deep and getting deeper. Step four: operators turn to on-site generation. Step five: each on-site generation technology fights for its slice — gas turbines (fastest to deploy but emissions-intensive), SMR nuclear (cleanest baseload but years from commercial reality), fuel cells (clean and modular but expensive per kWh), behind-the-meter solar plus storage (limited to favourable geography).
FCEL is one of three pure-play fuel-cell vendors with a credible product for this market. The 12.5 MW Power Block is its specific bid for the data-center slice. How big that slice ends up is the open question — fuel cells are economically competitive only where regional grid prices are high or carbon constraints are binding. The honest answer is no one knows yet. The 12.5 MW Power Block launch is FCEL trying to define the slice, not yet capturing it.
Where This Move Could Fail — Risk Read
Three failure modes worth pricing into any read of this tape.
1. Sector-rotation reversal. If BE rolls over on a 5–7% weekly decline, FCEL’s small-cap position amplifies the downside. Empirically, small-caps in retreating thematics lose 2–3× the percentage of the sector leader. Watching the cohort matters more than watching any single ticker — if BE is green on the week, FCEL holds support; if BE is red two weeks in a row, FCEL is exposed.
2. No hyperscaler customer announcement by Q3 earnings. The 12.5 MW Power Block launch needs validation. A quarterly call of “we’re in active discussions” without a named contract by Q3 2026 would reset expectations meaningfully. The current rally prices in the assumption that orders are imminent; absence of order news on the next two earnings calls is the most obvious catalyst for a meaningful pullback.
3. Dilution. FCEL has a history of secondary offerings to fund operations. A capital raise announced at $25–$27 would clip the stock 10–15% on the announcement alone, even if strategically sound — and stock-price weakness ahead of an announcement is itself an indicator that one is being prepared. A clean balance-sheet quarter without a raise becomes a positive tell.
The macro overlay matters too. A recession scare compressing 2026–2027 hyperscaler capex projections by even 10–15% would compress the AI-power trade by the same proportion. Watch this week’s macro tone in Market Pulse for any shift in the rate or growth backdrop.
Bottom Line
The 486% explained: a real product catalyst on March 23, four weeks of delayed accumulation, an eight-week green streak driven by 10× volume expansion, a coherent cohort move across the hydrogen complex, and a board appointment that landed on Thursday and got priced same-day. The stock is at the threshold of mid-cap, sitting at a new 52-week high, with RSI elevated but not yet diverging.
What would confirm continuation: a named hyperscaler customer contract, weekly closes consistently above $27, and continued sector-wide green weeks across BE, BLDP, and FCEL together. What would signal exhaustion: red weeklies on rising volume, sector laggards (PLUG) catching up while leaders (BE) fade, an RSI divergence, or a secondary offering announcement.
FCEL is doing what an eighth-green-week breakout stock does until it stops doing it. The story will eventually have to validate with revenue. Until then, the tape is what the tape is — and right now the tape says small-cap leader of a thematic rotation, on volume, with elevated but not yet exhausted momentum.
Get early access to Orbit
Orbit is Luna3.ai’s AI-augmented research engine. 12 algorithmic signals + a gradient-boosted ML model + an agentic LLM that reads each top pick’s filings (like FCEL) and writes a daily thesis with conviction score and catalyst proximity. Three regimes, three playbooks — growth in expansion, defensives in late-cycle, recovery plays at panic bottoms. The 3 in Luna3.ai.
No spam. Unsubscribe any time.
No comments yet. Be the first to share your thoughts!