
- Off-exchange venues now execute over half of all US equity volume — most institutional buying is invisible to anyone watching a chart.
- Real institutional execution uses iceberg orders, VWAP and TWAP algorithms, and dealer hedge chains engineered to NOT move price — ‘supply and demand zones’ miss the mechanism entirely.
- A systematic strategy reads the residue of institutional order flow through cumulative volume delta, absorption patterns, and off-exchange print data — and most of the data sources are free.
Open a one-minute SPY chart on any session and you will see the same pattern: price drifts sideways, lurches in one direction, then mean-reverts as if nothing happened. Most retail traders read that motion as supply and demand — sellers stepping in at “resistance”, buyers at “support”. The actual mechanism is something else. Real institutional order flow is engineered to avoid moving price, broken into hundreds of child slices and routed across more than a dozen venues so that nobody — including the trader watching the chart — can see the parent order moving through the tape. Once you understand the mechanism, the chart stops looking like zones and starts looking like a clean-up trail.
Why this matters
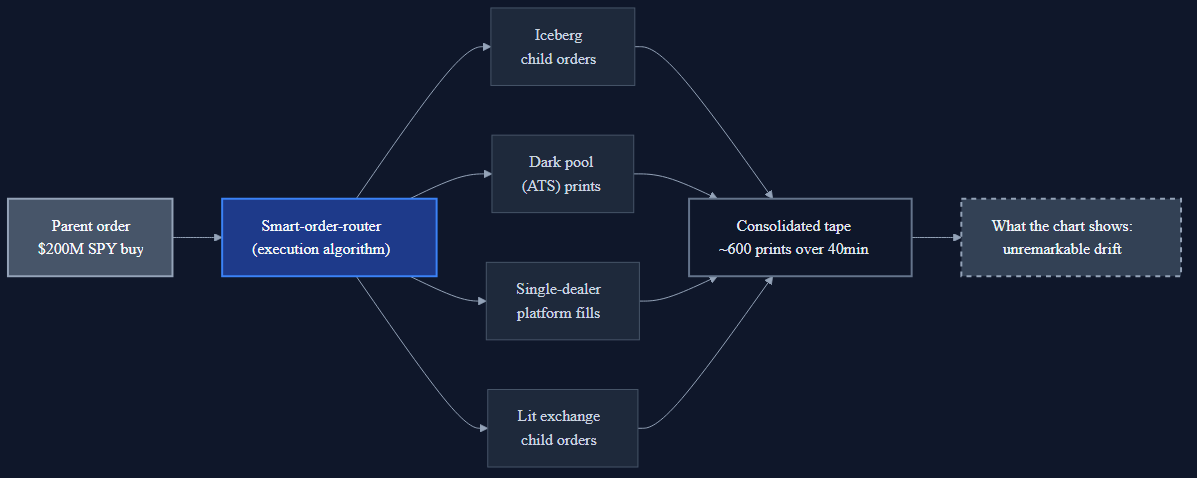
Picture a mutual fund rebalancing $80 million of SPY at quarter-end. If that order hit the open market in a single block, it would move the SPY mid by five to ten basis points before the fill completed — about $40,000 to $80,000 of slippage on its own size, plus the cost of telegraphing the trade to every algorithm watching the tape. So the desk does not send the order that way. It hands the $80M to a smart-order-router that breaks it into four to six hundred child slices, drips them across exchanges and dark pools over forty minutes, and reports each leg to the consolidated tape as a sequence of unrelated 200-share prints.
What the retail trader sees on a chart: an unremarkable forty-minute drift, maybe a few green prints leaning into the offer. What actually happened: an $80M institutional buy was executed in plain sight, and the chart’s “supply and demand zones” are an artifact of where the iceberg refills sat, not where retail traders clustered.
This mechanism gets worse to read every year. Off-exchange volume — trades that print to the FINRA Trade Reporting Facility instead of an exchange tape — has risen from around 36% of US equity volume in 2018 to over 50% by late 2024, according to SIFMA’s market-structure analysis. November 2024 was the first month in US equity market history where more volume executed off-exchange than on; January 2025 hit 51.8% per Bloomberg and Cboe data. More than half of institutional flow is now invisible to anyone watching a chart.
The cost of misreading this is concrete: stops placed where a retail trader thinks support is “strong” — but the strength was a single iceberg refill that pulled the moment it filled. Breakouts that go nowhere because the move was a child-slice algorithm finishing its parent. Reversals that look like “smart money entering” but were actually a dealer hedge unwinding into the close.
Why institutional order flow looks nothing like a supply-demand curve
The parent / child split. A $200M buy order never lands on a lit exchange as one print. The execution desk hands it to a smart-order-router (SOR) — an algorithm whose job is to fill the parent at the best volume-weighted price possible without disturbing the market. The SOR divides the parent into hundreds of child orders, typically sized to be invisible against the day’s average trade size for that name. For SPY, where the average trade is around 200 shares, child slices are usually 200 to 500 shares each. A single 200,000-share institutional buy might generate four to eight hundred separate prints on the tape across forty minutes.
Iceberg execution. Most child orders are iceberg-typed. An iceberg is a limit order where only a small “tip” — say, 500 shares of a 5,000-share clip — is displayed on the lit order book at any given moment. As the tip fills, the next slice refills silently. The visible Level 2 depth at most price levels is a fraction of what is actually queued. Order-book heatmaps on liquid US equities consistently show hidden depth running five to twenty times the displayed depth at the inside quote during institutional execution windows.
Algorithmic strategy: VWAP, TWAP, POV, Implementation Shortfall. Every parent order gets an execution strategy. VWAP (volume-weighted average price) tries to match the day’s volume curve — heavier in the open and close, lighter mid-day. TWAP (time-weighted average price) splits the order uniformly across a window regardless of volume. POV (percent-of-volume) maintains a fixed percentage of every print — typically 5 to 10% — until the parent is done. Implementation Shortfall trades aggressively when price drifts away from the decision price and slowly when it does not. Each algorithm leaves a different fingerprint on the tape, which is what a systematic strategy is reading when it tries to detect institutional flow.
Dark pools and off-exchange execution. Roughly half of US equity volume now executes off-exchange — in dark pools (alternative trading systems, or ATS) and in non-ATS off-exchange venues like single-dealer platforms. A trader can buy 500,000 shares of AAPL inside a dark pool without one print landing on a public exchange tape; the trade reports to the FINRA Trade Reporting Facility (TRF), which appears on the consolidated tape but with no venue attribution. The print looks identical to a regular exchange trade unless you are parsing the venue field from a direct SIP feed.
Dealer hedging chains. When a market-maker fills a 10,000-share buy from a customer, they hedge the resulting short exposure within milliseconds — usually by selling something correlated. An institutional SPY buy gets hedged by selling ES futures, which fades the ES bid, which then drags the dealer’s exposure in the largest SPX components: AAPL (about 7% of the index in 2026), MSFT, NVDA. So a single “trade” you see on the AAPL tape is often half of a hedge chain that started somewhere else entirely. The supply-and-demand frame cannot explain this because the buyer never wanted AAPL; the dealer just had to hedge SPY exposure.
Why supply-demand “zones” miss this entirely. The “zone” framing assumes price reverts at a level because retail buyers and sellers cluster at round numbers, prior highs, or visible chart features. The actual mechanism is different: the zones that work are usually where a specific iceberg refill is sitting, defending the level for a specific algorithmic reason — a VWAP child fill, an aggregator’s market-making position, a dealer’s gamma-hedging bracket. Once the iceberg fills or pulls, the level is just a price. Same chart, two completely different mechanisms — and the retail framing has no way to distinguish them. This is consistent with the academic literature on algorithmic execution, including Hasbrouck and Saar’s foundational 2013 paper on low-latency trading in the Journal of Financial Markets.
How an algorithm reads this
A systematic strategy does not look at “zones” or “support levels”. It looks at cumulative volume delta (CVD) and price absorption.
Cumulative volume delta is the running tally of signed market-aggression: every market-buy at the offer adds to delta, every market-sell at the bid subtracts. CVD does not measure who is right — it measures who is pressing. If price drifts down 0.3% while CVD goes flat or positive, somebody bought every market-sell that hit the bid and did not move the print. That is an institutional absorber — usually an iceberg refilling on the buy side at a defended level.
The mirror pattern matters more: price rallies and CVD goes negative. Somebody sold every market-buy that lifted the offer and did not let the print drift up. That is distribution — institutional selling into retail demand at a defended level. Both patterns produce the same chart shape (“zone holds”) but have opposite implications for what comes next. A systematic strategy that encodes “iceberg detection” — measuring the ratio of aggressive prints to price progression in a rolling five-minute window — can separate the two cases in real time.
The data sources matter more than the indicator. CVD is computable from Polygon.io aggregates at the retail tier, or for free on TradingView using a footprint chart with bid-ask imbalance shading. Bookmap visualises iceberg behaviour directly by showing displayed-versus-traded volume divergence. Dark pool prints are visible after-the-fact through FINRA’s ATS Transparency portal and through the Squeeze Metrics DIX index (free historical version), which converts off-exchange short-volume into a regime indicator. None of these tells you what to do — they tell you what is there. The difference between a “zone” that holds because retail clustered and a “zone” that holds because an iceberg is sitting on it is the entire margin a systematic strategy is trying to capture.
Signals worth tracking (and where to find them)
If you want to see the residue of institutional order flow on a chart, these are the data sources worth attention — most are free or near-free:
- Volume delta (CVD): free on TradingView via footprint charts and the “Cumulative Volume Delta” indicator (search by name). Paid: Bookmap shows it natively with venue colouring. Polygon.io aggregates if you are scripting your own pipeline.
- Iceberg detection: absorption patterns in CVD are the indirect read — price-not-moving despite aggressive volume implies an iceberg defended level. Direct read: Bookmap’s order-book heatmap shows refill events as bright pulses at a price level. No free direct-detection feed currently exists for US equities.
- Dark pool / off-exchange prints: FINRA publishes ATS quarterly statistics free at finra.org. Squeeze Metrics’ DIX index (free historical) converts daily off-exchange short-volume into a regime indicator with a long backtest history.
- Dealer gamma exposure: SpotGamma daily and Tier1Alpha are the paid leaders. Squeeze Metrics also offers a free GEX series with about 24-hour lag.
- COT report (futures positioning): CFTC.gov, free — released Friday at 3:30pm ET, reflecting positions as of the prior Tuesday’s close. Three-day lag; does not move with intraday flow.
- Options flow: CBOE LiveVol at institutional pricing, and Unusual Whales at retail pricing for unusual block prints. Pair with gamma exposure for the dealer-hedge read.
Where retail gets this wrong
Three misreads compound:
“The zone worked at 4520, so it will work at 4520 again.” The zone worked once because an iceberg refilled there during that session. The order filled (or got pulled) when the parent completed; the level is now just a price on the chart. The next time price visits 4520, there is no mechanical reason for it to hold. Second tests of a previously defended level fail more often than they work in liquid US equities — the level was a circumstance, not a property.
“Big volume bar equals institutional buying.” Volume by itself is direction-agnostic. A 10-million-share SPY bar tells you ten million shares changed hands, not that ten million shares were bought. Without delta, the bar could be an institutional buy (CVD up), an institutional sell (CVD down), or a balanced session of two-way flow (CVD flat). Retail platforms display volume without delta by default; the missing dimension is the one that matters.
“Algorithms are hunting my stop.” Half-wrong. The algorithms are not targeting you personally — they are filling a parent order that benefits from the liquidity your stop provides at the round number. Your 4495 stop sits next to twenty thousand other 4495 stops; when price drifts through that level and triggers them, the institutional buyer above is just absorbing the liquidity at a better price. The mechanism is impersonal but the outcome is the same. The framing shift matters because “stop hunting” suggests the algorithm is your adversary; the reality is you are an input variable in someone else’s execution algorithm. The SEC’s Regulation NMS requires venues to route to the best displayed price — which means every stop sitting at a round number is, by regulation, accessible to whoever needs liquidity there.
Going deeper
The charting platforms that surface volume delta and footprint data at the retail tier are reviewed in TradingView vs StockCharts. If you want to see institutional flow language applied to a single name — accumulation framing, dealer hedge chains, positioning reads — the JOBY analysis and the CLSK analysis both use that frame on real tickers. Future Trading-pillar deep-dives on stop loss mechanics, the COT report, and dealer gamma will sit alongside this one — bookmark the Trading category for the cluster.
Get early access to Orbit
Orbit is Luna3.ai’s AI-augmented research engine. 12 algorithmic signals + a gradient-boosted ML model + an agentic LLM that reads each top pick’s filings and writes a daily thesis with conviction score and catalyst proximity. Three regimes, three playbooks — growth in expansion, defensives in late-cycle, recovery plays at panic bottoms. The 3 in Luna3.ai.
No spam. Unsubscribe any time.
No comments yet. Be the first to share your thoughts!