- 3x leveraged ETFs reset every day, so multi-day compounding never matches a simple 3x of the index — the gap is called volatility decay and it widens with every choppy session.
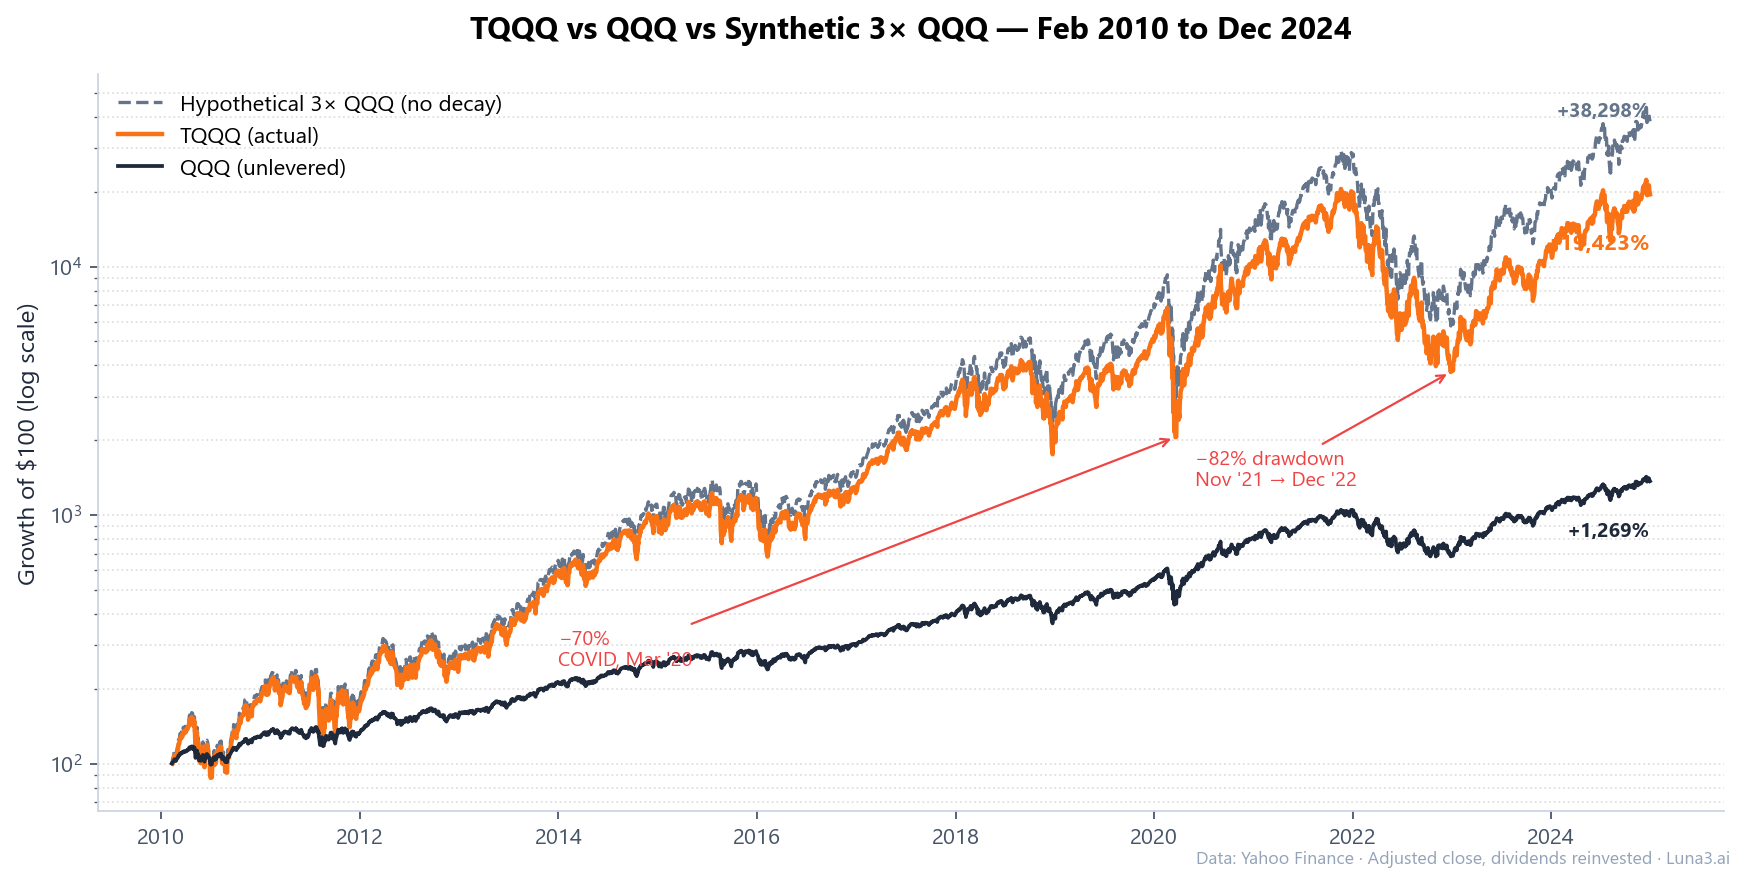
- TQQQ returned +19,400% from launch through end-2024, but a theoretical 3x QQQ position with no decay would have returned roughly +38,300% — decay swallowed half the levered upside.
- 2022 was the cautionary tale: TQQQ drew down 81.7% peak-to-trough between Nov 2021 and Dec 2022 — a $10,000 buy at the top became $1,830 at the bottom.
TQQQ launched February 9, 2010. From inception through December 31, 2024, it returned roughly +19,400% (with dividends reinvested) — turning a starting $1,000 into about $194,000. QQQ over the same window returned +1,269%. That sounds like the leveraged ETF did its job. But a hypothetical position that simply compounded 3× the daily QQQ return without any product-level reset would have returned about +38,300% — twice what TQQQ actually delivered. That structural shortfall is what people mean by leveraged ETF decay: a daily-reset 3× fund doesn’t compound the way a “3× hold” would, because volatility taxes every choppy session along the way. Understanding the math is the difference between using these products tactically and getting flattened by them.
What Leveraged ETFs Actually Promise
Leveraged ETFs deliver a multiple of their index’s return — but only over a single trading session. ProShares, the issuer of TQQQ, UPRO (3× S&P 500), and SQQQ (-3× Nasdaq-100), is explicit about this in every prospectus (a point the SEC's investor bulletin on leveraged and inverse ETFs echoes): the fund seeks “daily investment results, before fees and expenses, that correspond to three times (3x) the daily performance” of the underlying index. Direxion uses the same language for its TECL (3× Tech) and LABU (3× Biotech) products. The keyword is daily.
To deliver that daily multiple, the fund uses index swaps, futures, and options that reset overnight. After the close, the fund rebalances exposure so that the next morning starts again at 3× the current NAV. The reset is what creates the decay problem — it’s not a bug, it’s the design. If you understand what an ETF is at the structural level (a wrapper around a basket of holdings), a leveraged ETF is the same wrapper around derivative contracts that are renewed every trading day. The wrapper isn't broken. The mismatch is between what the wrapper delivers (daily multiple) and what most retail buyers expect (period multiple) — the same wrapper-vs-expectation gap we mapped out in our breakdown of ETFs vs mutual funds in 2026, just with leverage on top.
How Leveraged ETF Decay Actually Works
The cleanest way to see leveraged ETF decay is to walk through five days. Suppose the underlying index moves +5%, then −5%, then +5%, then −5%, then +5%. A retail investor might assume the levered fund delivers 3× that path. The math says otherwise.
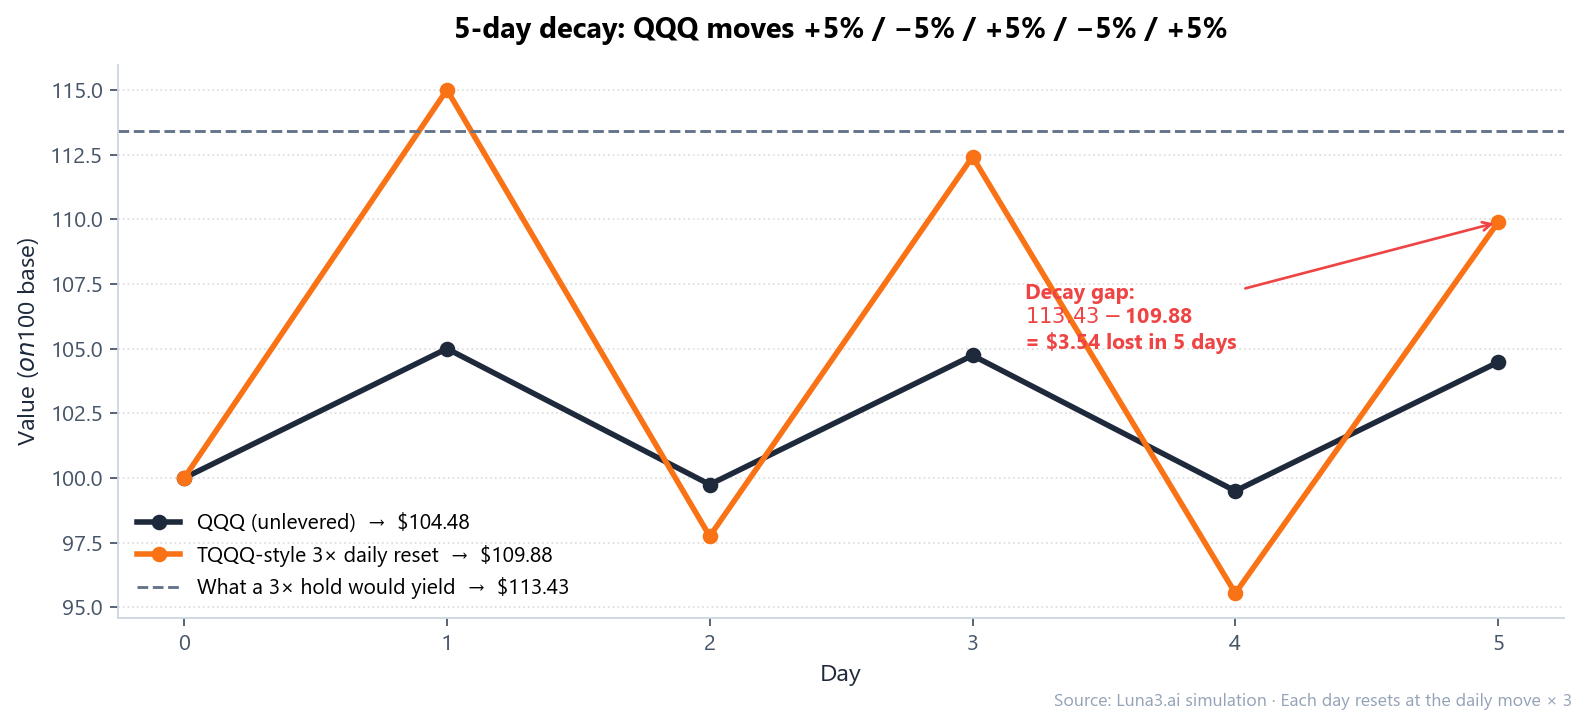
At the end of the five sessions, the unlevered index sits at $104.48 (a +4.48% gain). A naïve 3× of that ending return would suggest +13.44%. But the actual daily-reset 3× path ends at $109.88, a gain of only +9.88%. The gap — 3.56 percentage points lost in five sessions of nothing more than alternating moves — is volatility decay. It happens because each down day shrinks the base on which the next up day compounds, and the 3× amplifier makes that shrinkage worse than it would be on the unlevered version. Higher daily volatility = faster decay, regardless of which direction the index ultimately trends.
That’s why two markets with identical 6-month returns can produce wildly different leveraged ETF outcomes. A grinding-up market with low daily volatility lets the 3× fund roughly track 3× the index. A choppy sideways tape — even one that ends flat — slowly bleeds the levered fund through pure mathematics. The decay rate roughly scales with the square of the daily volatility, which is why the worst environments for these products are not crashes but high-volatility chop.
The Real Numbers — TQQQ, UPRO, and SSO vs Their Benchmarks
Three real comparisons against their benchmarks, all measured from each fund’s inception through December 31, 2024:
- TQQQ vs QQQ (Feb 2010 → Dec 2024): TQQQ +19,424%, QQQ +1,269%, synthetic 3× QQQ +38,299%. TQQQ delivered ~51% of the no-decay theoretical path. Max drawdown: −81.7% (peak November 19, 2021; trough December 28, 2022).
- UPRO vs SPY (Jun 2009 → Dec 2024): UPRO +7,724%, SPY +750%, synthetic 3× SPY +15,338%. UPRO captured ~50% of the no-decay path. Max drawdown: −76.8%, vs SPY’s −33.7%.
- SSO (2×) vs SPY (Jun 2009 → Dec 2024): SSO +2,987%, synthetic 2× SPY +4,477%. SSO captured ~67% of the no-decay path. Max drawdown: −59.3%. The 2× tier survived materially better than the 3× tier.
Two things to notice. First, even in a 15-year US equity bull run with one of the strongest secular tech rallies in market history, the 3× products captured only about half of the “no-decay” theoretical return. The other half went to volatility drag and fee compounding. Second, the 2× tier (SSO) was meaningfully closer to its theoretical multiple — about two-thirds delivered vs half. That’s not because SSO is a better-managed fund; it’s because doubling the daily move amplifies the decay term less aggressively than tripling it. If you’ve read our breakdown of how ETF categories produce different return profiles over 20 years, the principle is the same — the math of the wrapper drives outcomes more than the index choice.
The drawdowns are the part that ends the story for most buy-and-hold holders. TQQQ lost 82% peak-to-trough in 2022 — a $10,000 investment at the November 2021 high was worth $1,830 by late December 2022. Even the COVID crash in March 2020, which lasted only about a month, took TQQQ down 70%. UPRO lost 77% in 2022. SSO lost 59%. These aren’t tail risks the prospectus warns about politely; they are observed outcomes that recur every time the underlying index sees a sustained 30%+ pullback.
Who’s Actually Buying These (Inflow Data)
TQQQ is one of the largest leveraged ETFs in the world at $25 billion+ AUM and consistently sits in the top tier of US ETFs by daily trading volume. But the recent flow picture tells a different story: in 2024, TQQQ was actually among the top-five US ETF asset losers — net outflows of several billion dollars over the year — while standard QQQ pulled in $27.5 billion of net inflows. Investors are rotating out of leveraged exposure even as the underlying Nasdaq-100 has rallied. The pattern suggests the holders who got crushed in 2022 are using the 2024 recovery to exit, rather than holding through the next cycle.
The institutional context matters too. The FINRA Regulatory Notice 09-31, still the foundational guidance for these products, states that leveraged and inverse ETFs are “typically unsuitable for retail investors who plan to hold them for longer than one trading session, particularly in volatile markets.” That language is referenced in most broker-dealer suitability frameworks and most RIA investment policy statements — which is why you very rarely see leveraged ETFs in 13F filings or in advisor-managed portfolios. The products were designed for professional intraday hedgers, prop traders, and tactical position-managers, not for retirement accounts. When you see TQQQ in a top-volume list, it’s overwhelmingly retail flow through self-directed brokerage accounts.
The mirror image plays out on the inverse side. SQQQ (-3× Nasdaq-100) sees periodic retail surges when sentiment turns bearish — early 2022, late 2023, and again during the 2024 rate-scare windows. Holders treating SQQQ as a “short the Nasdaq” buy-and-hold get the same decay treatment, just in reverse. A choppy bear market eats into SQQQ exactly as a choppy bull market eats into TQQQ. The decay is symmetric.
When Leveraged ETFs Actually Make Sense
There are three legitimate use cases — all of them measured in days or weeks, not months or years.
Short-duration tactical exposure. If you have a thesis about a specific 1- to 5-day window — an earnings reaction, a Fed announcement, a CPI release — a leveraged ETF gives you index-multiplied exposure without the bid-ask, expiry, and theta-decay complications of options. The decay is real but minor on a 1- to 5-day timescale, especially if you’re directionally right and the volatility behaves.
Regime-filtered systematic strategies. The academic paper Leverage for the Long Run, published in 2016 by Michael A. Gayed and Charlie Bilello (it won that year’s Charles H. Dow Award), showed that leveraged exposure can outperform a buy-and-hold position only when filtered by a moving-average regime overlay: hold the leveraged fund when the broad market is above its 200-day moving average; rotate to cash or short-duration Treasuries otherwise. Volatility tends to cluster on the downside, so the rule keeps you out of the chop windows where decay is brutal and in only when the regime favours sustained trend. The strategy isn’t a free lunch — it produces material trading and tax friction — but it’s the rare backtested approach where 3× exposure compounds positively over decades.
Defined-risk substitute for deep ITM options. Some traders use a small position in TQQQ as a cheaper alternative to deep-in-the-money long-dated calls. The defined downside (100% of position size) and the absence of strike-price drift make leveraged ETFs simpler to size than equivalent options exposure, though you give up the asymmetric payoff that ITM calls provide on a fast move.
What none of these use cases involve is buying TQQQ in a Roth IRA in 2021 and forgetting about it. That position lost 82% over the next 13 months and would not have recovered its November 2021 peak value until early 2024 — even though QQQ itself was at all-time highs again by mid-2023. The decay-plus-drawdown combination is what makes leveraged ETFs structurally hostile to long-term holding, not the leverage itself.
The Bottom Line
Leveraged ETFs are not broken. They do exactly what their prospectuses describe — reset to a 2× or 3× daily multiple every trading session. The problem is that the daily multiple and the multi-period multiple are not the same thing, and the gap between them widens with volatility. Over fifteen years of mostly favourable conditions for the Nasdaq-100, TQQQ delivered roughly half of what a frictionless 3× hold would have produced, paid for that gap with two 70%+ drawdowns, and remains a top-traded ETF only because the retail base keeps rotating in and out faster than the decay catches up.
If your holding period is measured in days, the daily-reset design does what it says. If your holding period is measured in months or years and you’re hoping for compound 3× of the underlying, you’re betting against the math of the product itself. The flow data — 2024’s billions of net outflows from TQQQ while QQQ pulled in record inflows — suggests the lesson from 2022 is finally being learned. The 2× tier (SSO, QLD) is meaningfully more survivable than the 3× tier for anyone who wants amplified exposure without quite as steep a decay tax, but the same single-session reset logic applies. The wrapper hasn’t changed; the expectation has to. Read the prospectus, then read it again, and notice how many times the word “daily” appears before the word “performance.”
Get early access to Orbit
Orbit is Luna3.ai’s AI-augmented research engine. 12 algorithmic signals + a gradient-boosted ML model + an agentic LLM that reads each top pick’s filings and writes a daily thesis with conviction score and catalyst proximity. Three regimes, three playbooks — growth in expansion, defensives in late-cycle, recovery plays at panic bottoms. The 3 in Luna3.ai.
No spam. Unsubscribe any time.
No comments yet. Be the first to share your thoughts!