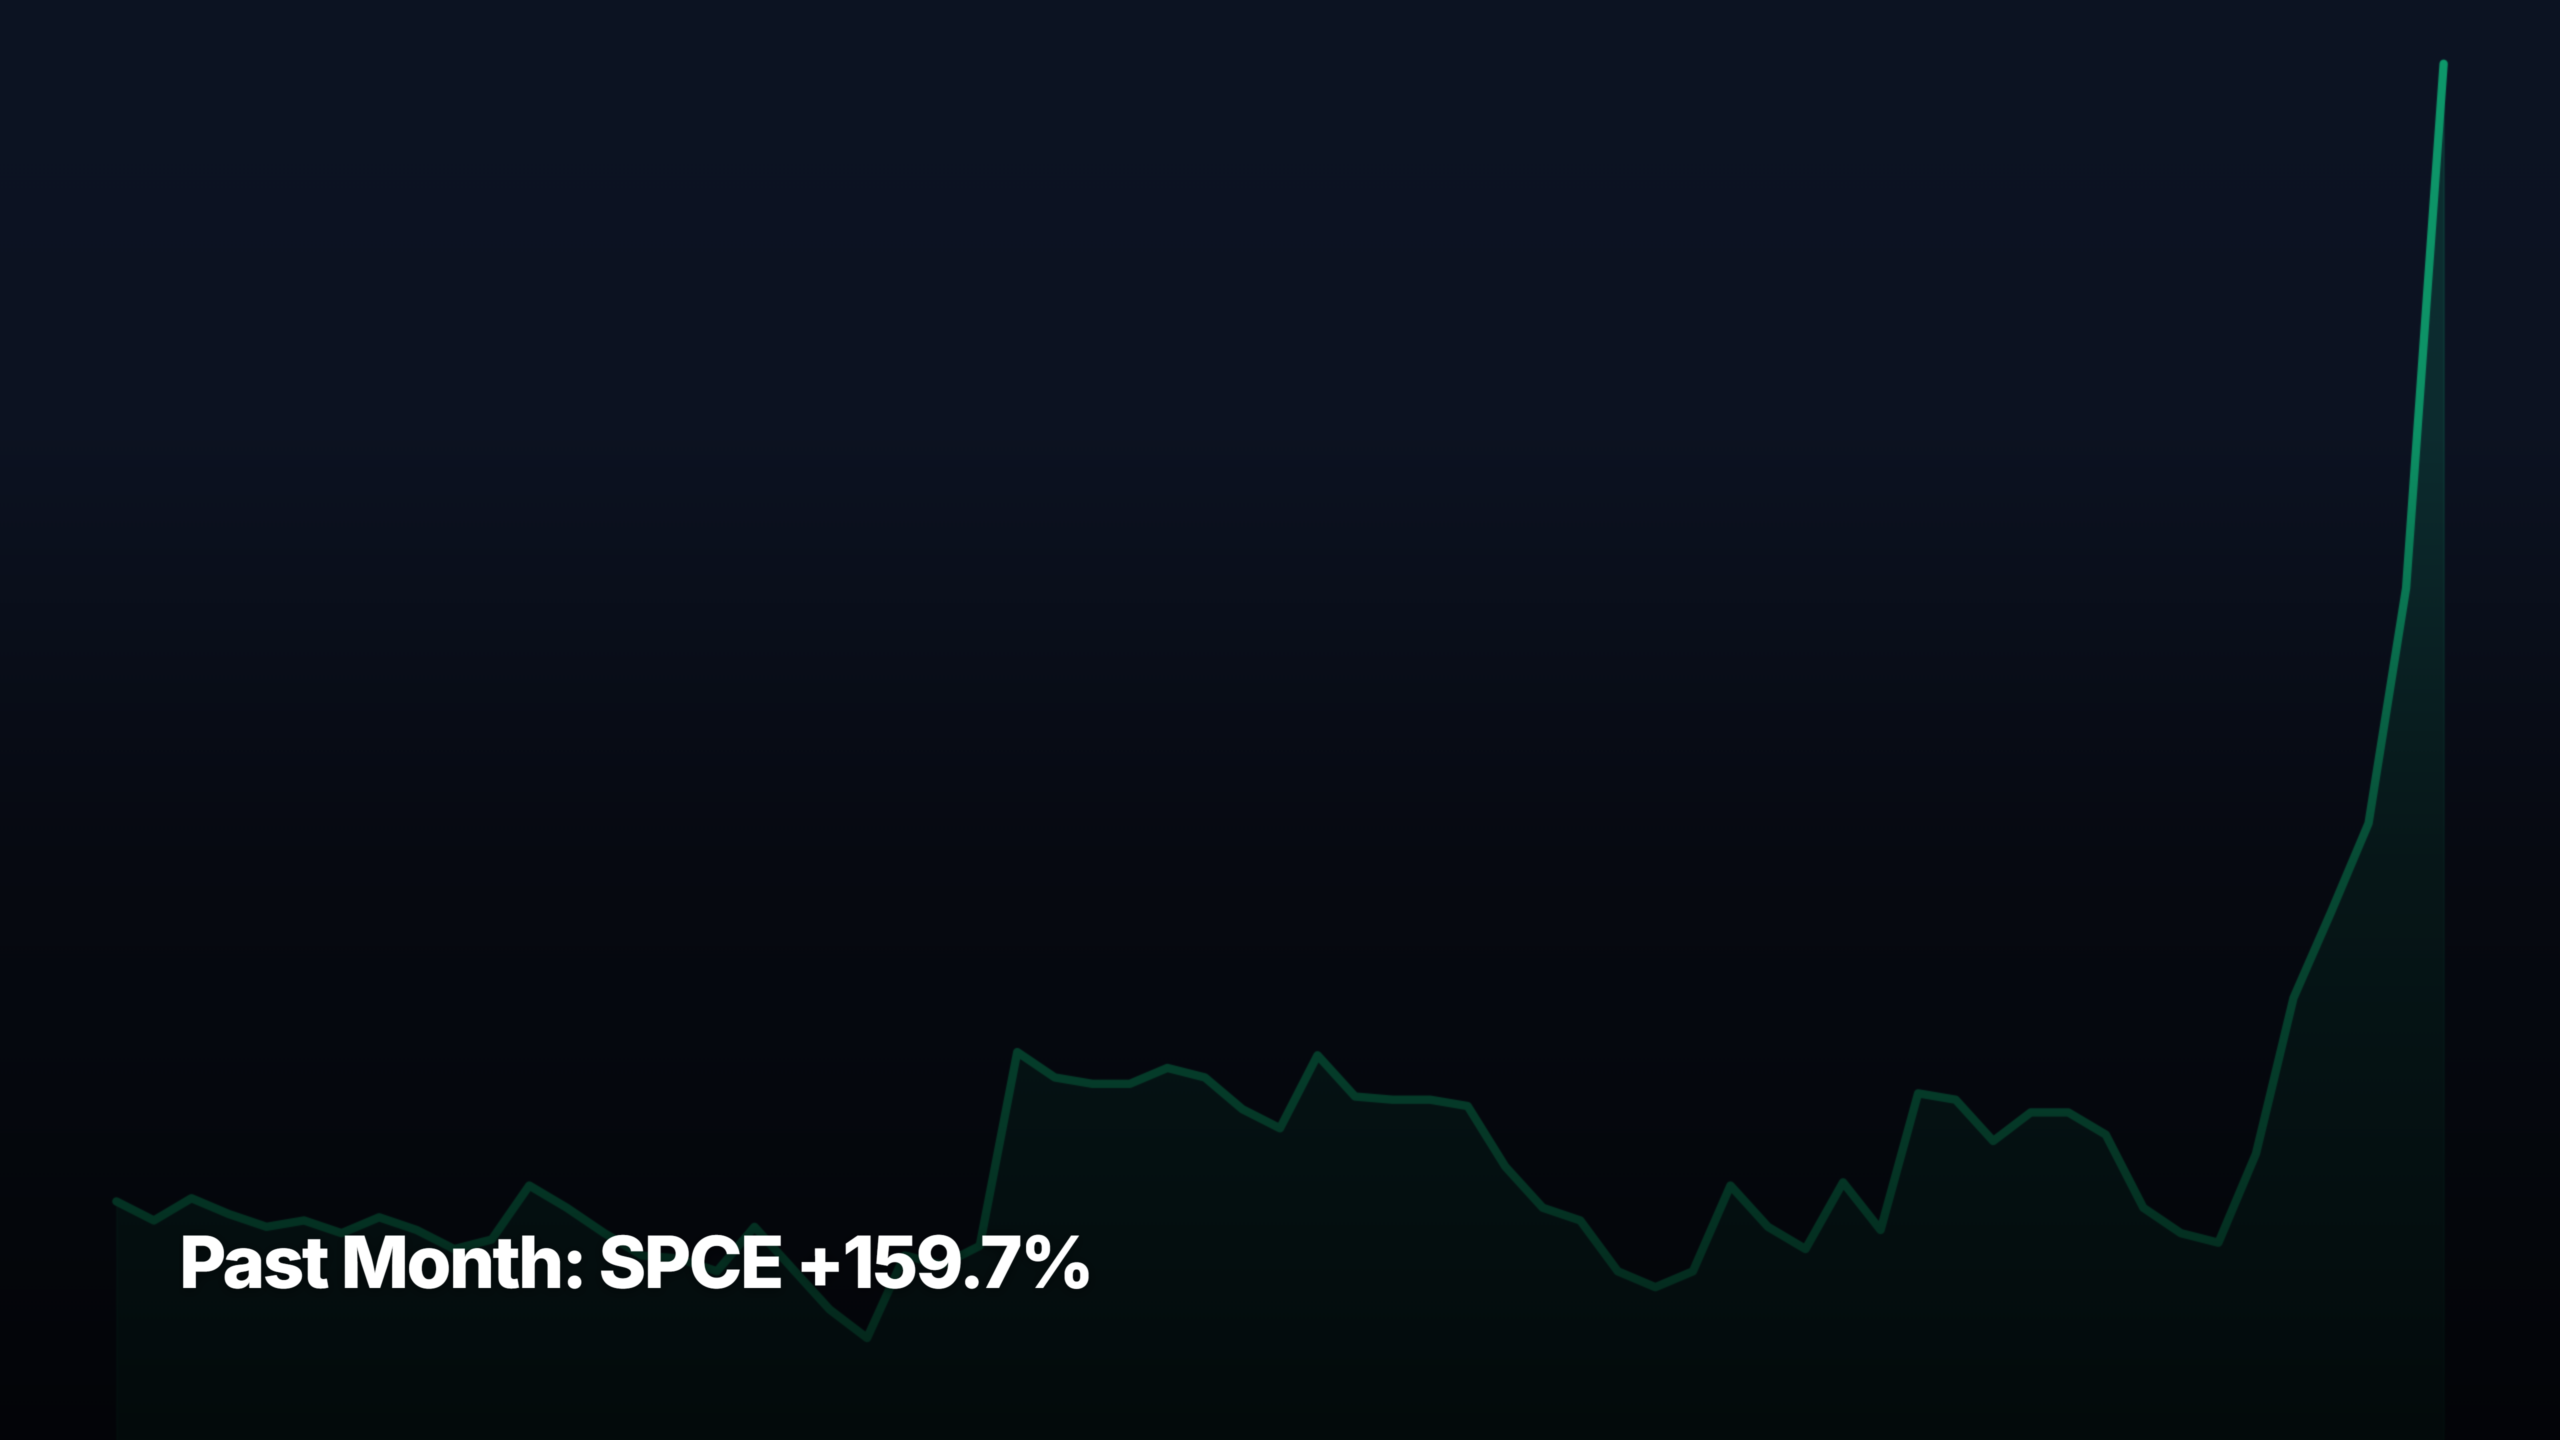
- SPCE +159.7% was the biggest gainer across all cap tiers over the past month through May 29, 2026.
- Top gainer: SPCE +159.7% (small-cap). Top decliner: BMBL -25.6%.
- Return spread between the biggest gainer and biggest loser across all tiers was 185.3 percentage points — wide dispersion.
These are the top stock movers for the past month through May 29, 2026, broken down by market-cap tier. SPCE +159.7% was the single biggest move across all four tiers. For each tier, the top 3 gainers and top 3 decliners are listed with a plain-English catalyst note and a pattern-recognition read — whether the move looks like a clean breakout, momentum continuation, mean-reversion bounce, or extended run with reset risk.
Universe: ~145 curated US common stocks (NYSE + Nasdaq, ≥$300M market cap, ≥$1M average daily dollar volume). Cap tier reflects current market cap, not historical.
Mega-cap leaders (above $200B market cap)
Top gainers — past month
1. ↑ AMD +59.68%
$516.10 · avg $16,292M/day · Mega-cap
Why: AMD’s near-60% monthly surge ties to broad-based AI chip enthusiasm and growing visibility into MI300/MI325 accelerator demand from hyperscalers. Headlines about new China export limits hit late but didn’t derail the move — investors are pricing AMD as a credible second source to Nvidia in AI compute, with data-center revenue trajectory increasingly central to the story.
Pattern: Clean trend continuation with momentum acceleration into month-end. The +60% range without a meaningful pullback looks extended versus typical mega-cap behavior, and a 10-15% reset would be normal digestion after a move of this size.
2. ↑ ORCL +36.04%
$225.78 · avg $4,260M/day · Mega-cap
Why: Oracle’s +36% reflects investors warming to its AI hyperscaler pivot, with OCI growth and the Stargate-related capex narrative pulling it into the same trade as AMD and Snowflake. Hyperscaler-debt headlines didn’t dent the rally — the market is treating Oracle’s cloud backlog as proof the AI infrastructure spend is multi-vendor, not Nvidia-and-three-clouds only.
Pattern: Stair-step advance with shallow pullbacks — textbook momentum trend. Less extended than AMD given Oracle’s slower historical beta, but still trading well above any reasonable short-term moving average. Pullback risk on first hyperscaler capex headline.
3. ↑ LLY +26.65%
$1,105.00 · avg $3,987M/day · Mega-cap
Why: Lilly’s +26.65% is a return-to-leadership move on GLP-1 strength, with fresh chatter about GLP-1s expanding into oncology adjacencies adding optionality to the existing obesity/diabetes franchise. After months of sideways action, the stock cleared $1,000 and accelerated as a defensive-growth holding amid the narrowing market-breadth concern flagged in the headlines.
Pattern: Base breakout from a multi-month consolidation, then trend continuation. Cleanest setup of the mega-cap winners — looks more sustainable than AMD or ORCL because the move started from a flat base rather than chasing existing momentum.
Top decliners — past month
1. ↓ WMT -9.11%
$115.75 · avg $3,426M/day · Mega-cap
Why: No single clear catalyst — Walmart’s -9% looks like rotation out of defensive consumer staples as risk appetite migrated toward AI compute and growth names. The market-fragility headline cuts both ways: when only 60% of S&P names are above their 200-day average, capital concentrates in the winners and leaks from the steady compounders that led earlier in the year.
Pattern: Orderly distribution after an extended uptrend — lower highs, lower lows, no panic selling. Looks like a normal multi-week reset rather than the start of a trending decline. Watch the 200-day moving average as the next decision point.
2. ↓ PEP -7.74%
$144.19 · avg $1,308M/day · Mega-cap
Why: No single clear catalyst — Pepsi’s -7.74% fits the same staples-rotation story as Walmart, compounded by ongoing share-loss concerns versus Coca-Cola in beverage and persistent volume softness in Frito-Lay. The ‘Pepsi makes big change’ headline reads as defensive product repositioning rather than a fundamental inflection.
Pattern: Trending decline with no clear support reclaim — weaker structure than Walmart. Stock has been underperforming the broader market for months, so this is continuation rather than a fresh break. Mean-reversion bounce risk if dividend yield approaches historical highs.
3. ↓ NFLX -6.77%
$86.02 · avg $2,592M/day · Mega-cap
Why: Netflix’s modest -6.77% looks like a digestion pullback rather than a thesis crack — the franchise-expansion and consumer-products headlines are actually constructive. After leading the mega-cap pack for much of the prior year, capital rotated toward AI infrastructure names this month, leaving Netflix in profit-taking territory without any fundamental concern.
Pattern: Shallow pullback within a longer-term uptrend. Looks like a healthy reset rather than distribution — the magnitude is consistent with normal volatility for a name that ran hard. No reset-potential flag; this is mid-trend cooling.
Large-cap leaders ($10B to $200B market cap)
Top gainers — past month
1. ↑ DDOG +88.03%
$247.35 · avg $1,316M/day · Large-cap
Why: Datadog nearly doubling on the month reflects a re-acceleration story — the FedRAMP High certification opens federal-government workloads, and broader software-AI enthusiasm pulled the stock back into favor after a difficult prior year. The ‘best S&P 500 stocks in May’ headline confirms institutional flows piled in once the breakout was confirmed.
Pattern: Explosive base breakout from a multi-month bottoming pattern, then vertical extension. The +88% pace is unsustainable and the stock is now far above any reasonable moving average — high reset potential on the first earnings or guide event.
2. ↑ SNOW +79.26%
$255.55 · avg $4,175M/day · Large-cap
Why: Snowflake’s +79% came on a blowout earnings print that confirmed AI workloads are translating into platform consumption — the $6B AWS AI commitment headline reinforced the moat narrative. The stock had been left for dead as the software laggard of the year, so the cover-and-chase dynamic from underweight positioning amplified the move.
Pattern: Gap-and-go breakout from a long basing structure — the cleanest large-cap setup of the cohort because it started from genuine underperformance. Still extended after the run, but the base provides a more durable floor than DDOG’s vertical move.
3. ↑ QCOM +67.35%
$251.02 · avg $6,643M/day · Large-cap
Why: Qualcomm’s +67% reflects a re-rating tied to AI-on-device momentum, growing data-center custom-silicon ambitions (the Arm-vs-Qualcomm headline highlights the competitive lens), and the broader semiconductor cohort lifting on AI demand. Stock had been a perennial underperformer in semis, so the catch-up trade once sentiment turned was sharp.
Pattern: Breakout from a multi-quarter range followed by momentum acceleration. Less vertical than DDOG, more sustained than ORCL — mid-trend structure with room to consolidate before the next leg if the AI-handset narrative gets confirmed by upcoming product cycles.
Top decliners — past month
1. ↓ INTU -17.20%
$331.53 · avg $2,941M/day · Large-cap
Why: Intuit’s -17% reflects investor concern over TurboTax revenue exposure as AI-native tax tools emerge, even as the company’s own AI roadmap (Mailchimp AI tools, Intuit Assist) tries to defend the franchise. The job-cuts and restructuring headlines hint at margin pressure that the market is pricing as a structural rather than cyclical issue.
Pattern: Sharp break below prior consolidation range — distribution-top structure forming. Looks like the start of a trending decline rather than a buyable dip; needs evidence of stabilization before mean-reversion play is reasonable.
2. ↓ CMCSA -10.02%
$24.87 · avg $762M/day · Large-cap
Why: No single clear catalyst — Comcast’s -10% continues a long downtrend tied to cord-cutting, peacock-streaming-loss concerns, and broadband subscriber softness. The ‘prolonged share price slide’ framing in valuation-check headlines tells you sentiment has decisively turned to value-trap concern rather than dip-buying.
Pattern: Continuation of an established downtrend, no reversal pattern visible. Stock keeps making lower lows — algorithmic read is to avoid until a multi-week base forms. Dividend yield is the only support thesis right now.
3. ↓ MDT -9.88%
$73.81 · avg $900M/day · Large-cap
Why: Medtronic’s -9.88% sits inside the broader medical-device weakness as investors await Q4 earnings and parse divestiture noise from peer Teleflex. The recession-proofing income headline is the tell — defensive med-tech names are being treated as bond-proxies in a falling-rate environment but lacking the growth kicker that’s driving the rest of the market.
Pattern: Slow trending decline with shallow bounces failing at lower highs. Looks like distribution within a multi-year range rather than fresh breakdown. Mean-reversion candidate if Q4 earnings clear a low bar, but no chart-based reason to anticipate that yet.
Mid-cap leaders ($2B to $10B market cap)
Top gainers — past month
1. ↑ FCEL +117.91%
$21.66 · avg $237M/day · Mid-cap
Why: FuelCell’s +118% on a tiny float is a clean-energy momentum chase rather than a fundamental inflection — the Bloom Energy comparison headline suggests retail and momentum funds rotated into the fuel-cell theme as data-center power demand narratives broadened beyond uranium and natural gas. No earnings catalyst, no contract win disclosed publicly that justifies the magnitude.
Pattern: Vertical short-squeeze structure on a low-float, low-dollar-priced stock — classic high-reset candidate. Moves of this magnitude without earnings catalyst typically give back 40-60% within weeks unless followed by a real fundamental confirmation.
2. ↑ AKAM +56.70%
$149.54 · avg $629M/day · Mid-cap
Why: No single clear catalyst — Akamai’s +57% looks like a re-rating tied to its security and edge-compute pivot finding traction, and a low-expectations setup before earnings. The absence of fresh headlines is itself telling: this is a quiet institutional re-accumulation move rather than a retail-driven chase, which historically holds better than news-driven spikes.
Pattern: Multi-week base breakout followed by sustained advance — one of the cleaner technical setups in the cohort despite minimal news flow. Less extended than DDOG, more durable than FCEL. Watch first pullback to the breakout zone as the test.
3. ↑ GTLB +38.37%
$31.05 · avg $123M/day · Mid-cap
Why: GitLab’s +38% combines a product-cycle catalyst (GitLab 19.0 with expanded DevSecOps features) with the broader AI-software cohort lift (Snowflake, Oracle, ServiceNow rallying together). Q1 earnings preview adds anticipation. The DevSecOps angle matters because security-integrated developer tools are pricing as a more defensible AI moat than pure code-completion plays.
Pattern: Base-and-breakout structure with a product-launch confirmation candle. Less vertical than DDOG/SNOW so the reset risk into earnings is lower. Trend-continuation candidate if the Q1 print confirms the new product cycle is monetizing.
Top decliners — past month
1. ↓ BMBL -25.59%
$3.17 · avg $7M/day · Mid-cap
Why: No single clear catalyst — Bumble’s -25.6% continues a multi-quarter trending decline driven by user growth concerns, monetization pressure across the dating-app category, and ongoing leadership transition. At a $3 handle and $7M daily dollar volume, the stock has moved from growth-name to micro-cap-stress territory.
Pattern: Established trending decline with declining volume — distribution that has run its course but no basing visible yet. Classic value-trap setup until a strategic catalyst (acquisition, activist) emerges. Reset upside on any positive surprise but no reason to anticipate one.
2. ↓ ZG -21.26%
$35.36 · avg $40M/day · Mid-cap
Why: Zillow’s -21% reflects renewed housing-market anxiety as mortgage-rate volatility persists and the AI-agents-handle-rentals headline hints at competitive disruption to listing aggregators. The retirement-affordability theme reinforces a softening housing-demand narrative that hits Zillow’s transaction-tied revenue model directly.
Pattern: Sharp break below prior support — distribution top after a multi-month range. Looks like trend initiation lower rather than a single shock; mean-reversion bounces should be sold until housing-rate sentiment improves.
3. ↓ RBLX -15.97%
$47.15 · avg $478M/day · Mid-cap
Why: Roblox’s -16% is digestion after a strong prior run rather than a thesis break — the Renaissance Technologies headline and the AI/entertainment-business commentary confirm institutional interest remains intact. The pullback fits a broader rotation away from consumer-discretionary growth into AI infrastructure names this month.
Pattern: Pullback within an established uptrend — testing the 50-day moving average area. Less concerning structurally than INTU or BMBL because the higher-timeframe trend is still up. Reset to support, not distribution top.
Small-cap leaders ($300M to $2B market cap)
Top gainers — past month
1. ↑ SPCE +159.66%
$6.18 · avg $337M/day · Small-cap
Why: Virgin Galactic’s +160% rides the SpaceX-IPO-near-$1.8T headlines pulling capital into anything space-themed, plus the company’s own VSS Unity flight-test program restart adding a credible operational milestone. The valuation-after-surge headline tells you the move is already being questioned — euphoria-driven rather than fundamentally underpinned.
Pattern: Parabolic low-priced short-squeeze structure — highest reset risk in the cohort. Triple-digit gains on a stock with operational losses typically retrace 50%+ once the sympathetic-theme narrative cools. Treat as a trade not a position.
2. ↑ BLDP +102.90%
$6.29 · avg $82M/day · Small-cap
Why: No single clear catalyst — Ballard Power’s +103% rides the same hydrogen/fuel-cell theme as FCEL, with no company-specific headlines justifying the magnitude. Pure sector-rotation into clean-energy names as the AI-power-demand story broadened beyond nuclear into adjacent decarbonization themes.
Pattern: Vertical momentum move in sympathy with FCEL — both stocks moved together on theme rather than on individual fundamentals. Classic distribution-of-strength candidate; the absence of company-specific news is the red flag.
3. ↑ KEEL +96.54%
$5.68 · avg $231M/day · Small-cap
Why: KEEL’s +96.5% — the recently rebranded Keel Infrastructure (formerly BITF) — reflects the AI-data-center power pivot getting validation flows. The Aschenbrenner buying headline matters because it signals smart-money endorsement of the bitcoin-miner-to-AI-infrastructure conversion story that’s playing out across several names in the cohort.
Pattern: Base breakout with follow-through — structurally cleaner than FCEL/SPCE because there’s a real corporate transformation underpinning the move rather than pure theme chasing. Still extended at this pace; first pullback to breakout zone is the test.
Top decliners — past month
1. ↓ GME -15.58%
$21.18 · avg $108M/day · Small-cap
Why: GameStop’s -16% follows profit-taking after a prior squeeze episode, with capital migrating into other meme-adjacent themes (the Hyperliquid PURR headline shows that energy moved to crypto). The eBay stake increase is the only constructive story, and even that reads as a defensive use of cash rather than operational momentum.
Pattern: Distribution following a sharp prior advance — fading momentum, not yet a clean downtrend. Behaves more like a structural high-volatility name than a trend stock; mean-reversion bounces should be expected but not chased.
2. ↓ MVIS -6.15%
$0.61 · avg $4M/day · Small-cap
Why: No single clear catalyst — MicroVision’s -6% on $4M daily dollar volume is barely a real move; at a sub-$1 handle this is microcap drift rather than a thesis-driven sell-off. Lack of contract wins or earnings progress continues to weigh on a name that depends on automotive-LiDAR design wins that haven’t materialized at scale.
Pattern: Low-volume sideways-to-down drift near multi-year lows. No technical setup either way — this is a binary-catalyst name where the chart tells you nothing until a contract announcement either confirms or kills the thesis.
What the past month cohort tells us
Large-cap was the standout tier this month — DDOG +88%, SNOW +79%, QCOM +67% — telling you institutional money chased the AI-software re-rating after months of underperformance versus mega-cap semis. Mega-cap leadership rotated within itself: AMD, ORCL, and LLY led while staples (WMT, PEP) and slower-growth consumer (NFLX) lagged, a clean risk-on signal disguised as ‘narrow leadership.’ The fragility headline flagged in card 3 cuts both ways — capital is concentrating in AI-infrastructure and weight-loss winners while leaking from defensives. Small-cap winners (SPCE +160%, BLDP +103%, FCEL +118%) look more like sympathy chases on space and clean-energy themes than fundamental moves, which historically reset hard. Mid and small-cap decliners cluster in housing-adjacent (ZG), consumer-discretionary (BMBL, RBLX), and value-trap territory (CMCSA, MDT) — meaning the rotation is growth-over-value, large-over-small at the quality end and theme-over-fundamentals at the speculative end. Dispersion is wide: a 175-point spread between the best winner and worst decliner in a single month signals regime urgency. Forward: watch whether the large-cap software winners can hold their breakouts on the first pullback — that confirms whether this is a durable rotation or a one-month chase.
Bottom line
The top stock movers recap covers every US market-cap tier from mega ($200B+) to small ($300M-$2B). The Past Month view shows sustained leadership and sector rotation — complementary to the daily session recap (single-session moves, Tue-Sat morning Melbourne time).
Get early access to Orbit
Orbit is Luna3.ai’s AI-augmented research engine. 12 algorithmic signals + a gradient-boosted ML model + an agentic LLM that reads each top pick’s filings and writes a daily thesis with conviction score and catalyst proximity. Three regimes, three playbooks — growth in expansion, defensives in late-cycle, recovery plays at panic bottoms. The 3 in Luna3.ai.
No spam. Unsubscribe any time.
No comments yet. Be the first to share your thoughts!