
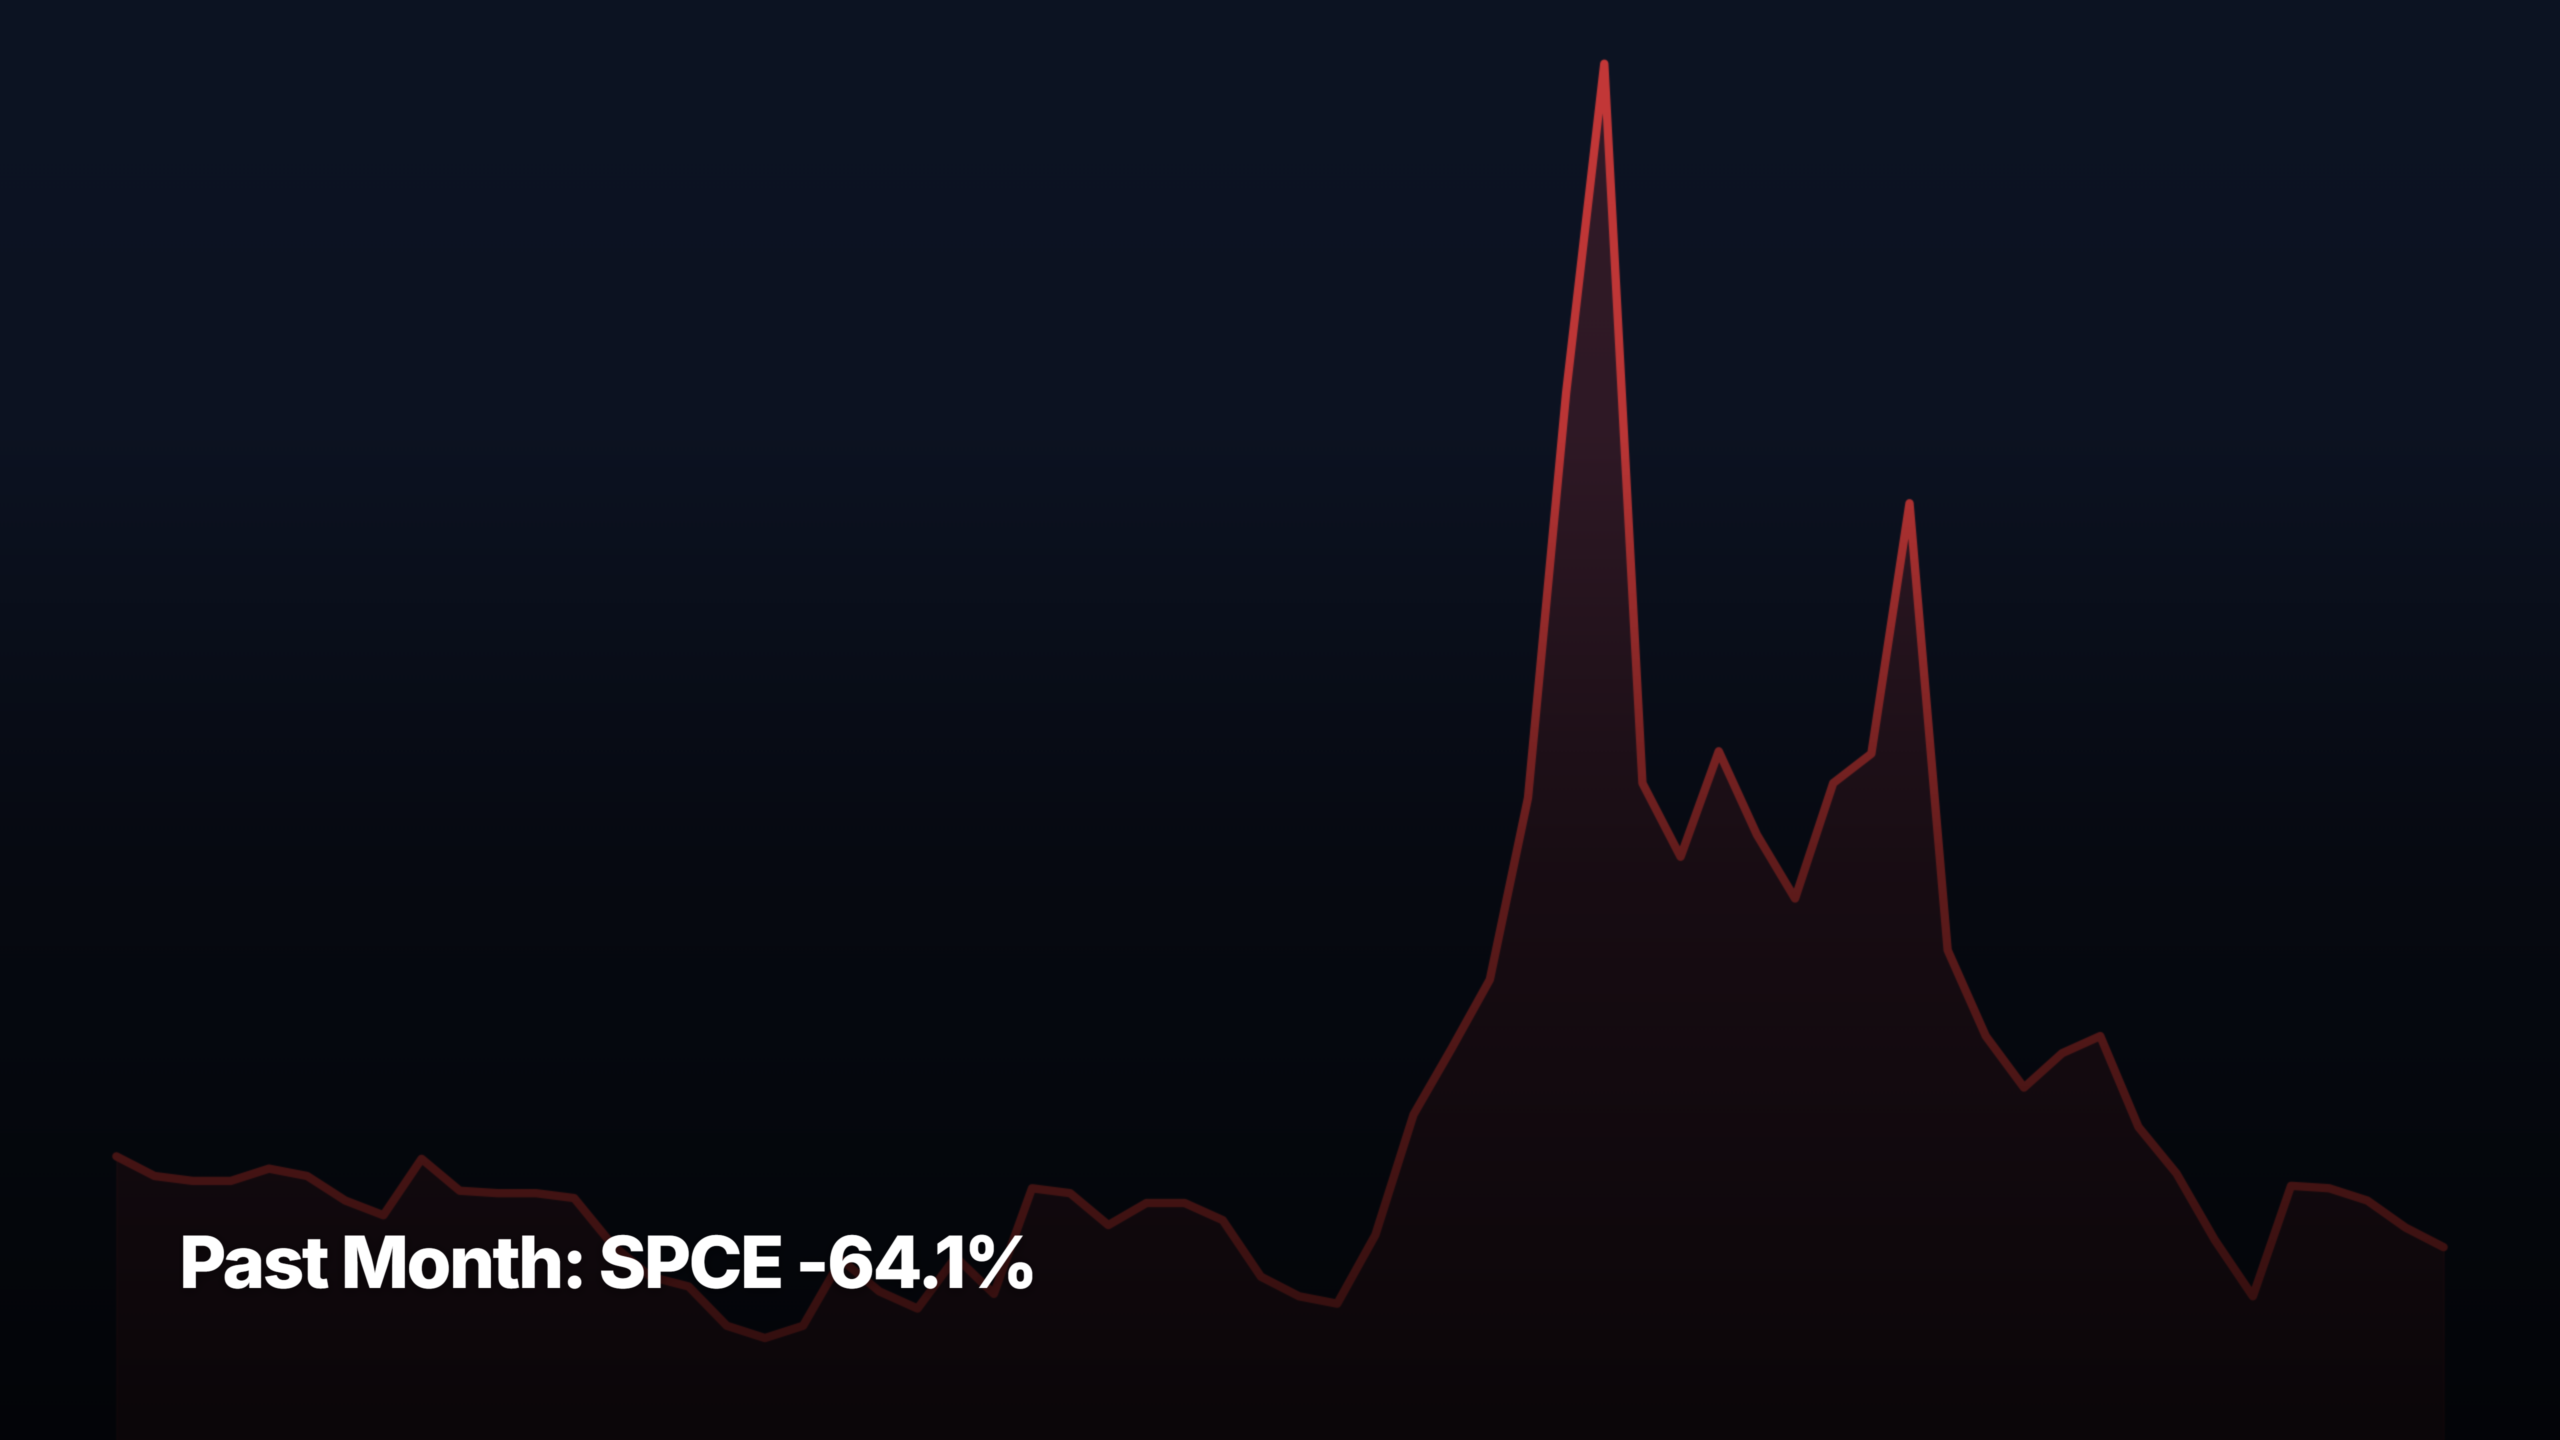
- SPCE -64.1% was the biggest decliner across all cap tiers over the past month through July 2, 2026.
- Top gainer: HIMS +32.6% (mid-cap). Top decliner: SPCE -64.1%.
- Return spread between the biggest gainer and biggest loser across all tiers was 96.7 percentage points — wide dispersion.
These are the top stock movers for the past month through July 2, 2026, broken down by market-cap tier. SPCE -64.1% was the single biggest move across all four tiers. For each tier, the top 3 gainers and top 3 decliners are listed with a plain-English catalyst note and a pattern-recognition read — whether the move looks like a clean breakout, momentum continuation, mean-reversion bounce, or extended run with reset risk.
Universe: ~145 curated US common stocks (NYSE + Nasdaq, ≥$300M market cap, ≥$1M average daily dollar volume). Cap tier reflects current market cap, not historical.
Mega-cap leaders (above $200B market cap)
Top gainers — past month
1. ↑ ABBV +22.61%
$261.07 · avg $4,238M/day · Mega-cap
Why: AbbVie caught a classic defensive rotation bid as investors fled tech volatility, with dividend-aristocrat status pulling in yield-seeking flows. Solid Q1 therapeutics numbers reinforced the safety trade, though a fresh congressional probe over China clinical trials capped the last leg. The move was driven more by macro positioning than any single catalyst.
Pattern: Clean uptrend with steady higher lows — looks like accumulation rather than a squeeze. RSI is likely stretched near the highs but the base underneath is real. Momentum still constructive but reset odds rising if the tape stays defensive.
2. ↑ JNJ +17.69%
$263.04 · avg $2,458M/day · Mega-cap
Why: J&J rode the same defensive-healthcare bid as ABBV, amplified by fresh IMAAVY clinical data widening the addressable patient pool. Coverage from income-focused outlets highlighting its dividend resilience pulled retail flows in during a risk-off tape. No single blockbuster catalyst — more a slow, steady re-rating as capital rotated out of expensive tech.
Pattern: Grinding trend higher on light-to-moderate volume — the textbook pattern for a rotation beneficiary. No parabolic acceleration, no distribution signs yet. Move looks sustainable but the easiest gains are probably behind; base-building near highs more likely than another vertical leg.
3. ↑ HD +16.06%
$357.90 · avg $1,777M/day · Mega-cap
Why: Home Depot bounced hard as consumer-staples-adjacent names benefited from the risk-off rotation, with the retail cohort catching a coattail bid alongside Costco commentary. No standalone catalyst — the move looks tied to easing rate expectations and a defensive positioning shift rather than any operational news out of Atlanta.
Pattern: Steady advance off a well-defined base, breaking through prior resistance around $340. Momentum constructive but the move is already extended relative to the 50-day. Reset risk moderate if broader market softens; base support looks solid on any pullback.
Top decliners — past month
1. ↓ ORCL -43.47%
$140.27 · avg $5,701M/day · Mega-cap
Why: Oracle’s worst month since 1990 — a sharp reversal of the AI-infrastructure narrative that drove it above $250. AI-bubble concerns, questions about Stargate economics, and hyperscaler-capex sustainability all hit at once. No single earnings miss; this was a positioning unwind as the market re-priced whether AI capex returns justify current multiples.
Pattern: Classic distribution top followed by trending decline — vertical breakdown through multiple support levels with no meaningful bounce. The move is extended to the downside and oversold on shorter timeframes; a technical reset bounce is plausible, but the primary trend has clearly shifted.
2. ↓ AVGO -21.51%
$360.45 · avg $10,187M/day · Mega-cap
Why: Broadcom got caught in the same AI-capex unwind that hit Oracle, with hyperscaler spending sustainability now openly questioned. Custom silicon growth story still intact per sell-side, but positioning was crowded and any doubt about the AI infrastructure buildout triggered fund de-risking across the semi-AI complex.
Pattern: Sharp break from an extended uptrend — looks like the first serious distribution phase after months of momentum. Move is extended to the downside and near-term oversold, but the higher-timeframe structure still holds. Reset bounce likely; whether it holds depends on hyperscaler capex commentary.
3. ↓ ADBE -19.82%
$219.72 · avg $1,534M/day · Mega-cap
Why: Adobe kept sliding on the persistent “software left for dead in the AI rotation” narrative — the market can’t decide if generative AI is a tailwind or a threat to Creative Cloud pricing. A notable insider boosting his stake 130% didn’t stop the drift lower. No specific catalyst; this is multi-month re-rating of software business models.
Pattern: Trending decline with lower highs and lower lows — no base yet formed. Insider buying is a fundamental signal but not a technical one. Extended to the downside short-term but no reversal structure visible; needs to stop making new lows before mean-reversion setups become tradable.
Large-cap leaders ($10B to $200B market cap)
Top gainers — past month
1. ↑ GE +16.30%
$377.52 · avg $1,980M/day · Large-cap
Why: GE Aerospace continued its steady climb on strong commercial aerospace demand and defense-adjacent tailwinds. Coverage debating it vs Lockheed as top pick reflects the broader capital rotation into industrials with real earnings power. No single catalyst — this is a durable multi-quarter re-rating story finding a bid in a risk-off tape.
Pattern: Clean base-and-breakout structure — extended but well-behaved, riding the 20-day like a rail. Momentum still intact with volume confirming the move. Reset odds are moderate given the run, but no distribution signs; more likely to consolidate sideways than crack.
2. ↑ RTX +14.24%
$199.25 · avg $943M/day · Large-cap
Why: RTX benefited from renewed defense-spending focus around the NATO summit, with Trump-Putin talks on Ukraine and Iran plus North Korean missile tests keeping geopolitical risk premium in bids. Defense-stock picks lists highlighting resilience during macro uncertainty pulled institutional flow into the primes.
Pattern: Steady trend higher with a well-defined channel — momentum constructive, no signs of blow-off. Breakout through prior resistance around $190 held cleanly. Move is a shade extended but the pattern is orderly enough that pullbacks should find buyers at the breakout retest.
3. ↑ AMGN +13.68%
$374.15 · avg $947M/day · Large-cap
Why: Amgen caught the healthcare defensive bid with the rest of large-cap pharma. Roche’s positive NSCLC head-to-head data lifted the whole oncology cohort by proxy. Being flagged on Nasdaq 100 research lists brought incremental flow. No single Amgen-specific catalyst — this is capital rotating into defensive earnings streams.
Pattern: Steady advance from a multi-month base — the setup looks like early-innings accumulation rather than late-cycle chase. Momentum constructive, no distribution signs, RSI healthy. Reset risk low near-term; more likely to consolidate near highs before the next leg than to break down.
Top decliners — past month
1. ↓ IREN -40.58%
$38.82 · avg $1,884M/day · Large-cap
Why: IREN got hit on a $700M CEO stock award announcement that raised dilution and governance concerns exactly when the market was souring on speculative AI-infrastructure names. Bitcoin miner pivoting to AI hosting is a crowded trade; sentiment turn plus company-specific overhang made it a leader on the downside.
Pattern: Sharp breakdown from a parabolic top — classic post-blow-off distribution pattern. Move is extended to the downside and oversold, but the higher-timeframe structure has clearly shifted. Bounce setups are tradable but low-conviction; primary trend has flipped.
2. ↓ ACN -30.13%
$137.35 · avg $1,838M/day · Large-cap
Why: Accenture cracked on the same AI-eats-consulting narrative that has haunted the name for quarters — Microsoft’s new $2.5B enterprise-AI unit reinforced fears that hyperscalers are moving up the value chain into integrator territory. No earnings miss cited; this is multiple compression as the market re-prices consulting durability.
Pattern: Sustained trending decline with no meaningful bounce — lower highs, lower lows, high volume on breakdown candles. Extended to the downside near-term and oversold, but no reversal structure has formed. Needs a base before mean-reversion setups become worth taking.
3. ↓ QCOM -22.75%
$176.25 · avg $4,543M/day · Large-cap
Why: Qualcomm got dragged lower with the AI-chip complex despite hyperscaler-deal headlines and the Hugging Face partnership. The tape treated any semi exposed to smartphone cycle plus AI hopes as a de-risking target once the AI-capex narrative wobbled. Fundamentals didn’t shift much — sentiment did.
Pattern: Sharp decline from range highs — the pattern is more like a positioning unwind than genuine trend change. Extended near-term and finding first support here. Mean-reversion bounce is set up but needs broader semi tape to stabilize first.
Mid-cap leaders ($2B to $10B market cap)
Top gainers — past month
1. ↑ HIMS +32.56%
$36.80 · avg $664M/day · Mid-cap
Why: Hims caught a strong bid on speculation that a Trump FDA may broaden peptide access — a direct tailwind for Hims’ compounded-GLP1 and telehealth wellness offerings. The setup taps directly into the retail-friendly weight-loss narrative that has powered the stock for months.
Pattern: Momentum breakout from a multi-week base — clean structure with volume confirming. Move is extended near-term but pattern is healthy; higher-timeframe uptrend intact. Reset odds moderate given the vertical portion of the move, but no distribution signs yet.
2. ↑ FCEL +31.91%
$28.11 · avg $612M/day · Mid-cap
Why: FuelCell Energy ripped as capital rotated into non-AI power-transition names — the “beyond AI software” theme found fuel cells as a proxy for clean-power infrastructure. Wall Street coverage flagged it as fully priced after a 411% run, but momentum flows kept pushing it higher regardless.
Pattern: Parabolic momentum extension — the pattern is clearly overheated and reads more like a squeeze than a durable trend. Extended on every timeframe. High reset probability; the setup no longer offers favorable risk/reward and any first sign of distribution will trigger a sharp pullback.
3. ↑ HOOD +24.25%
$112.73 · avg $3,192M/day · Mid-cap
Why: Robinhood advanced on the broader retail-broker theme with AI trading tool rollouts across the industry keeping the automated-investing narrative hot. Being called out alongside Apple, SpaceX and Sandisk in tech futures coverage brought incremental momentum flow. No single catalyst — sentiment and product velocity did the work.
Pattern: Momentum uptrend with a clean base-to-breakout structure around $100. Move is extended but well-supported by volume. No distribution signs; more likely to consolidate near highs than reverse. Reset odds moderate but the trend is intact.
Top decliners — past month
1. ↓ PLUG -32.99%
$2.64 · avg $160M/day · Mid-cap
Why: Plug Power fell in the absence of specific news — the story is the same recurring one: dilution risk, cash burn, and no clear path to profitability. With no fresh catalyst and speculative small-cap risk appetite fading, the name drifted lower on general de-risking rather than any single event.
Pattern: Trending decline in a name that has been in a multi-year downtrend — nothing about the pattern suggests a base yet. Low absolute price makes percentage moves noisy. Extended to the downside short-term but no reversal setup; more like a slow bleed than a capitulation.
2. ↓ AKAM -26.52%
$113.17 · avg $444M/day · Mid-cap
Why: Akamai declined without a fresh trigger in the last 72 hours — the drift lower reflects ongoing concerns about legacy CDN margin pressure and the difficulty of pivoting fast enough into security and edge compute. Software-cohort weakness during the AI-capex reset amplified the fade.
Pattern: Sustained trending decline with lower highs and lower lows — clear downtrend, no base formation yet. Extended near-term but no reversal structure visible. Mean-reversion bounces will be shallow until the tape shows a proper capitulation or basing structure.
3. ↓ ASAN -19.07%
$7.34 · avg $46M/day · Mid-cap
Why: Asana caught the small-cap software drift lower amid the broader “skeptical of stocks under $10” narrative that flagged it directly. No fresh operational news — just persistent concerns about growth deceleration and profitability path in work-management software as enterprise budgets tighten.
Pattern: Range-bound decline near multi-year lows — the pattern is closer to distribution at low levels than a clean downtrend. Low dollar volume amplifies moves. No reversal structure; needs to hold current levels and form a base before any bounce is worth taking.
Small-cap leaders ($300M to $2B market cap)
Top gainers — past month
1. ↑ STUB +27.58%
$12.86 · avg $172M/day · Small-cap
Why: StubHub gained on strong secondary-ticket demand narratives despite an investigation opened over alleged World Cup ghost ticketing. The regulatory overhang was outweighed by momentum flows and coverage highlighting the 30%+ monthly gain — reflexive buying by short-term traders drove much of the tape.
Pattern: Momentum breakout from a shallow base — early-stage trend structure. Move is extended near-term but not parabolic. Reset odds moderate given the regulatory headline risk. Pattern still constructive if the investigation stays a news item rather than becoming a fundamental drag.
2. ↑ GME +6.84%
$22.82 · avg $103M/day · Small-cap
Why: GameStop drifted modestly higher on the recurring Ryan Cohen narrative — targets rising, EBay pursuit, and mixed valuation coverage. No single catalyst; this is baseline meme-stock optionality with a slow bid rather than a squeeze. Volume was moderate, more grind than fireworks.
Pattern: Range-bound consolidation with a slight upward tilt — the pattern is orderly and reflects the low-catalyst environment. No breakout or breakdown signals. Sits in a wait-and-see structure where the next big move likely needs a Cohen announcement or short-interest catalyst to break the range.
Top decliners — past month
1. ↓ SPCE -64.10%
$2.70 · avg $58M/day · Small-cap
Why: Virgin Galactic collapsed with no company-specific news — the -64% move reflects ongoing dilution pressure and the market’s shrinking patience for pre-revenue space names as risk appetite for speculative small caps faded. The Chamath headline about a different AI venture is unrelated but underscores capital moving away from legacy SPACs.
Pattern: Capitulation-scale trending decline — the move is extreme even for a speculative name. Extended to the downside on every timeframe. Reset bounces will happen but the primary trend is broken; needs a genuine base at multi-year lows before mean-reversion setups become worth taking.
2. ↓ ONDS -44.95%
$7.41 · avg $691M/day · Small-cap
Why: Ondas fell hard without a fresh catalyst in the last 72 hours — the reversal reflects momentum unwinding in speculative defense-drone names as the small-cap risk-appetite tape softened. When a stock runs on narrative alone, the drawdown when narrative fatigue sets in is proportional to the move that came before it.
Pattern: Sharp breakdown from a parabolic top — classic post-momentum distribution pattern. Extended to the downside and oversold, but the higher-timeframe uptrend is now clearly broken. Reset bounces are tradable but low-conviction until a proper base forms.
3. ↓ BLDP -44.13%
$3.52 · avg $25M/day · Small-cap
Why: Ballard Power slid alongside PLUG and the broader hydrogen/fuel-cell decliners without a fresh catalyst. The cohort is caught between fading policy-driven demand narratives and persistent cash-burn concerns. When capital rotates away from clean-energy speculation, the whole group unwinds together regardless of company-specific news.
Pattern: Trending decline in a multi-year downtrend — no base structure yet. Low dollar volume makes moves choppy. Extended to the downside short-term but no reversal setup visible; more likely to keep drifting lower or consolidate at low levels than to bounce meaningfully without a sector catalyst.
What the past month cohort tells us
The past month tells a clear rotation story: mega-cap defensives (ABBV, JNJ, HD) and industrial-quality names (GE, RTX, AMGN) led while AI-infrastructure and enterprise software (ORCL, AVGO, ADBE, ACN, QCOM) got taken to the woodshed. That’s a textbook risk-off rotation — capital fleeing crowded AI-capex trades into dividend payers, defense primes, and healthcare. The macro read is unambiguous: the market is questioning whether hyperscaler capex returns justify the multiples paid, and money is voting with its feet toward earnings durability. Return dispersion is wide — SPCE -64% while GME +7% in the same tier — signaling a stock-pickers’ regime where thematic exposure matters more than beta. The clean-energy speculative cohort (PLUG, BLDP, FCEL bucking as an exception) shows retail risk appetite specifically for speculative small caps is fading. Forward-looking: watch whether the defensive bid persists into month two or reverses. If ORCL/AVGO stabilize while ABBV/JNJ stall, that’s the rotation reversing; if defensives keep grinding and AI-cap-ex names keep bleeding, the market is telling us it’s pricing a genuine growth scare, not just a positioning unwind.
Bottom line
The top stock movers recap covers every US market-cap tier from mega ($200B+) to small ($300M-$2B). The Past Month view shows sustained leadership and sector rotation — complementary to the daily session recap (single-session moves, Tue-Sat morning Melbourne time).
Get early access to Orbit
Orbit is Luna3.ai’s AI-augmented research engine. 12 algorithmic signals + a gradient-boosted ML model + an agentic LLM that reads each top pick’s filings and writes a daily thesis with conviction score and catalyst proximity. Three regimes, three playbooks — growth in expansion, defensives in late-cycle, recovery plays at panic bottoms. The 3 in Luna3.ai.
No spam. Unsubscribe any time.
No comments yet. Be the first to share your thoughts!