- VIX futures sit in contango — sloping up from spot — on roughly 80% of trading days. Holding that curve costs money.
- Volatility ETFs like VXX and UVXY roll positions daily, selling cheaper near-term futures and buying more expensive ones. Each roll bleeds NAV.
- The curve only flips during panic — and the panic usually arrives after the move you wanted to hedge is already done.
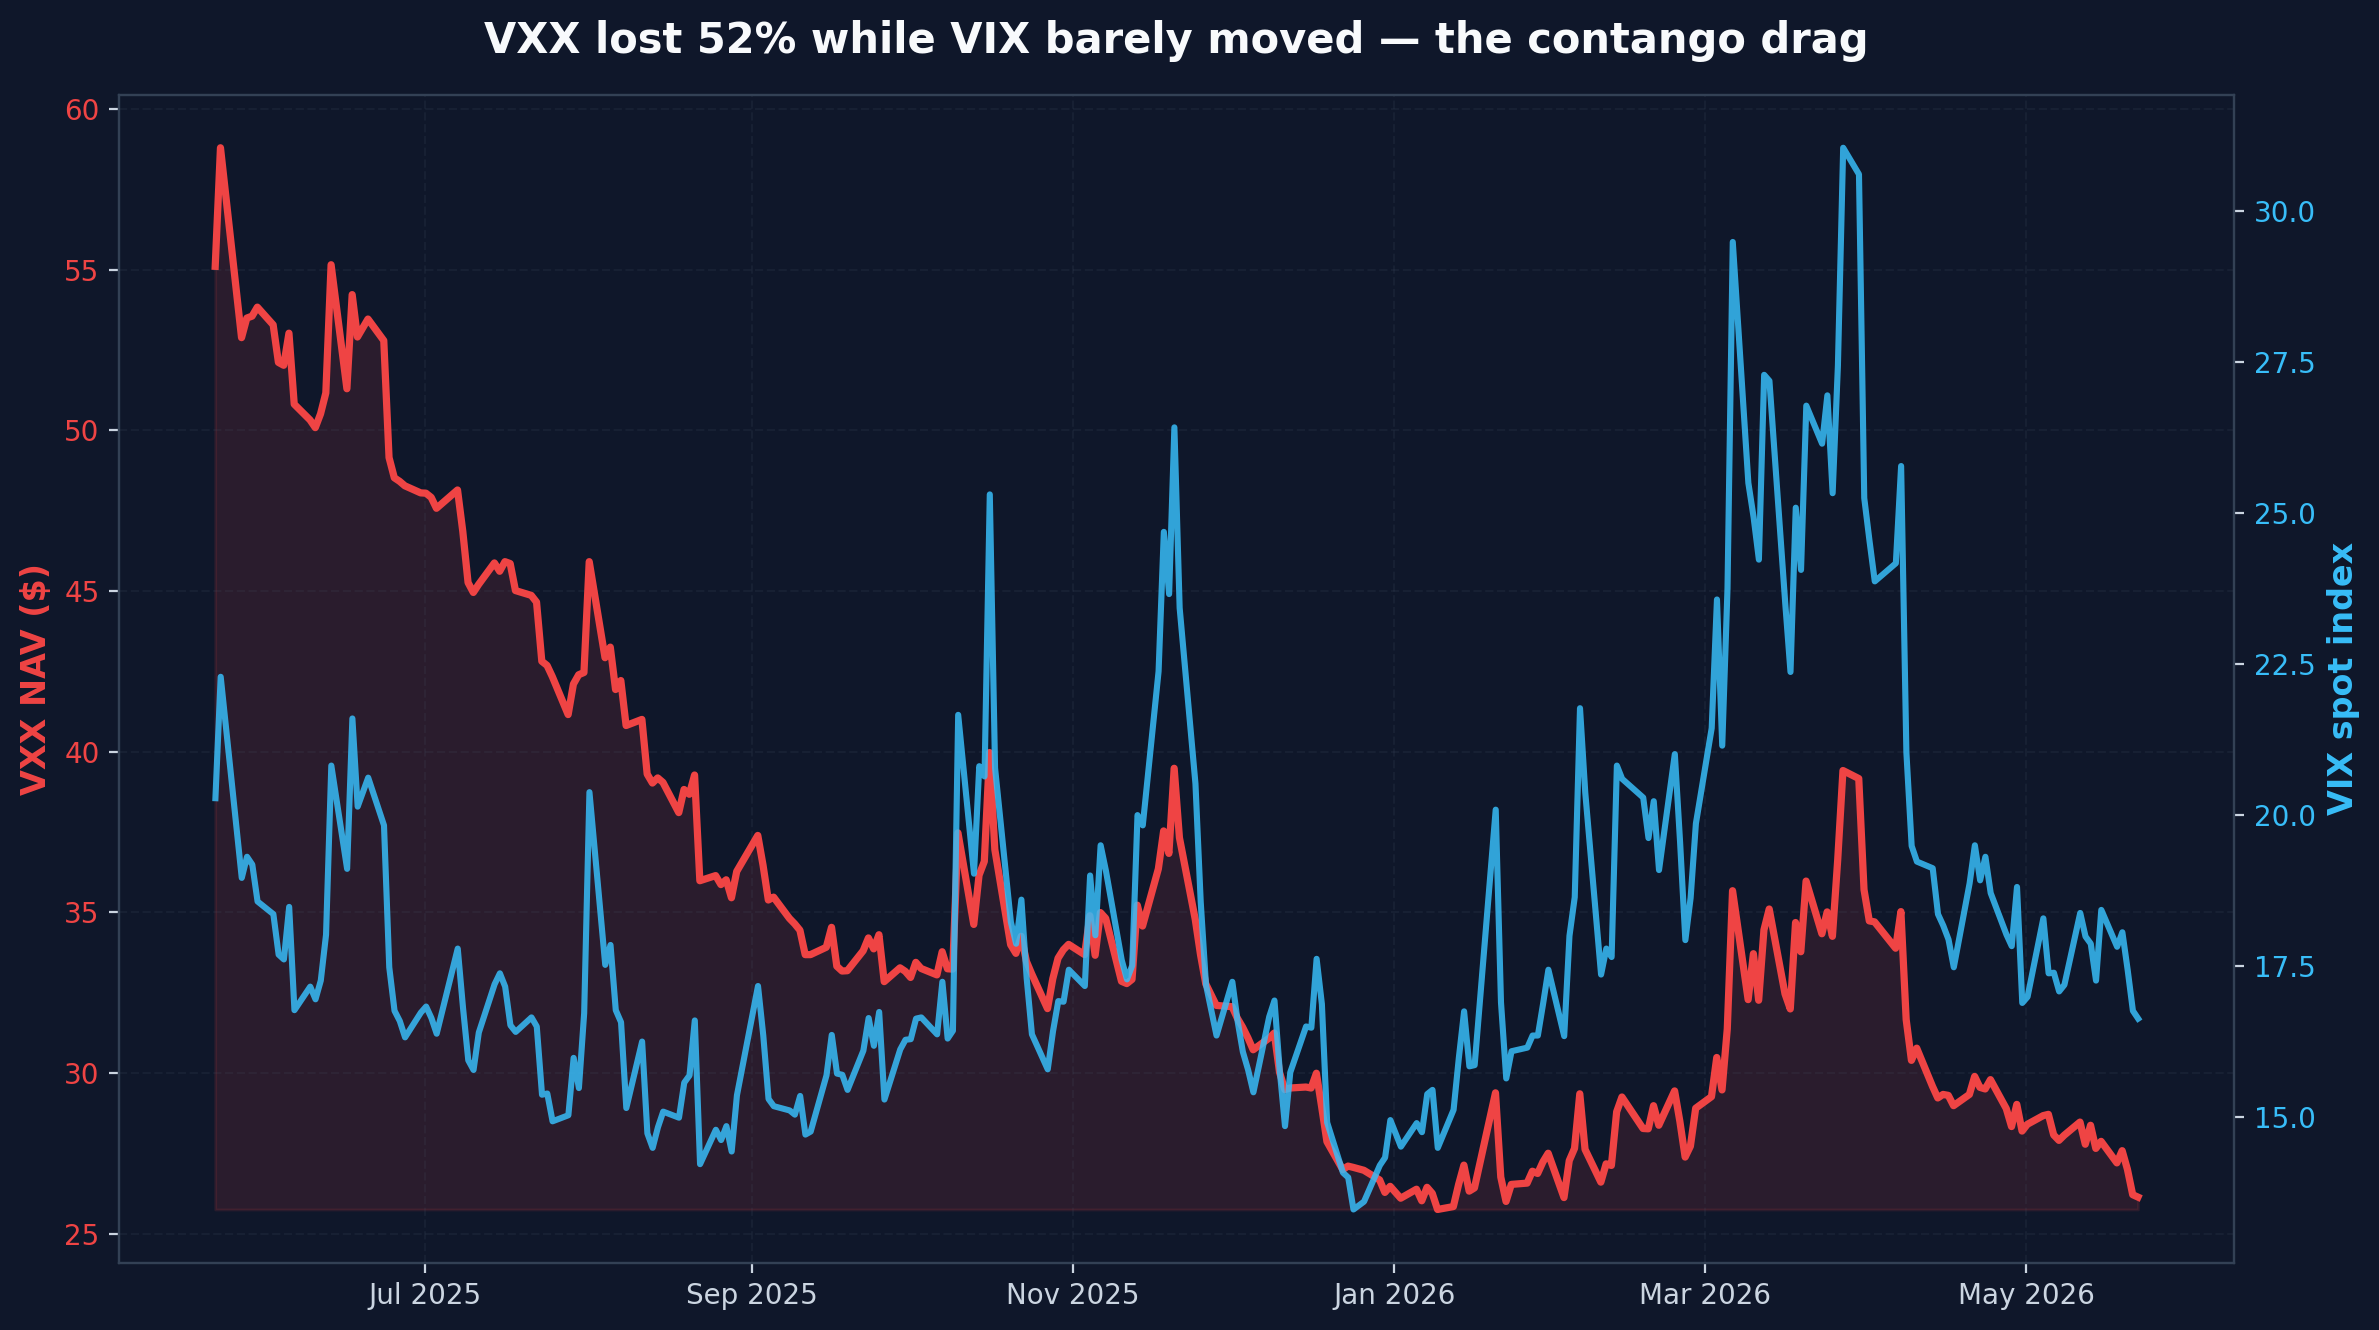
A trader who bought VXX a year ago to hedge their portfolio is sitting on a 52% loss. The VIX itself barely moved over the same window — from about 20 to 17. So how does a fund that tracks volatility lose half its value while volatility stays roughly flat? The answer is the VIX term structure — the shape of the VIX futures curve — and it has been quietly draining money from long-volatility holders for over a decade. This piece is about the mechanism, not a how-to-trade guide. The goal is to make you fluent in why these products behave the way they do.
What the VIX Term Structure Actually Tells You
The VIX you see on every finance screen is a 30-day implied-volatility snapshot derived from S&P 500 option prices. It is not something you can actually buy. You cannot purchase “the VIX” the way you buy SPY. What you can buy are VIX futures — contracts that settle to the spot VIX on a specific future date. There is a front-month contract, a second-month, a third-month, and so on, stretching about nine months out. The line that connects today’s VIX with each forward contract is the term structure.
In a calm market that curve slopes up. The front month trades a few percent above spot VIX, the second month a bit higher, and so on. That upward shape is contango. In a panic, the curve inverts: spot VIX rockets above the front month and the front above the second. That inverted shape is backwardation. Same curve, two regimes. The whole economics of long-volatility ETFs lives in which regime is in force on any given day.
Why Contango Is the Default
Volatility tends to revert to a mean. It sits at low to moderate levels for long stretches, then spikes hard, then drifts back down. When spot VIX is at 14, the market reasonably prices a future move back toward its long-run average around 19 — and that expectation gets baked into the futures price. On top of that, the people selling vol futures demand a premium for taking the tail risk on the other side. Those two forces — mean reversion plus a risk premium — keep the curve sloping up most of the time.
The empirical record bears that out. The VIX futures curve has been in contango on more than 80% of trading days since 2010. The longest unbroken stretch on record ran 273 trading days through 2004 and 2005. The most striking modern run lasted roughly 20 months — April 2020 through December 2021 — during which the curve refused to invert even as the post-pandemic narrative swung wildly. The 20% of days when backwardation shows up cluster tightly around stress events: the February 2018 volmageddon, the March 2020 COVID crash, and the August 2024 yen-carry unwind when the VIX briefly spiked above 65.
How a Volatility ETF Bleeds NAV
The big long-vol products are VXX (an ETN from Barclays), VIXY (ProShares), and the leveraged UVXY (also ProShares, targeting 1.5x daily). All three track the same underlying index, and all three replicate it the same way: every single trading day, the fund sells a slice of the front-month VIX futures contract and buys a slice of the second-month contract. The goal is to keep a constant 30-day average maturity in the portfolio.
That sounds neutral. It is not. When the curve is in contango, the front month is cheaper than the second month — so the daily rebalance is a forced sell-low, buy-high operation. The loss is real cash. If the front sits at 18 and the second at 19.2, that is a 6.7% premium across a month. Spread across daily rolls, the fund bleeds something like 0.2 to 0.3% of NAV per session, even when nothing is happening in the market.
Over a year of mostly-contango sessions, that compounding gets brutal. Published estimates put the annual drag on long VIX ETPs at 30 to 50% in ordinary years, and 40 to 80% in deep-contango years like 2017 or 2021. The chart above shows VXX losing 52% over the last twelve months while spot VIX was almost unchanged. Textbook outcome. The leveraged UVXY lost 72% in the same window. The inverse cousin SVXY (which targets −0.5x daily) collected most of that erosion as carry — which is precisely the trade institutional vol desks run on the other side.
If you have read our piece on leveraged ETF decay, the underlying logic will feel familiar. Different mechanism — daily compounding versus futures roll — same lesson: the product behaves nothing like the thing the ticker symbol implies.
When the Curve Flips — and Why It Doesn’t Save You
Backwardation is the regime that makes long-vol ETFs work at all. When spot VIX is above the front month and the front above the second, the daily roll becomes sell-high, buy-low. VXX gains NAV from the rebalance itself, on top of any directional move in the futures it holds. This is the window where these products do what their marketing copy promises.
The catch is the window’s shape. Backwardation episodes are violent and short — usually two to four weeks. The modern record was 76 trading days during the 2011 European debt crisis. Outside the two or three big crises, every other episode has been measured in single-digit or low-double-digit sessions. By the time a panic has driven the curve into backwardation, the equity decline that you wanted to hedge is mostly behind you. Buy-and-hold protection trades lose two ways: they pay the carry through 80% of sessions, and when the 20% finally shows up they are either already underwater or being asked to chase a panic from the wrong side.
Our piece on gamma squeeze mechanics tells a similar story from a different angle: a trade that looks like a steady trickle of premium decay until the regime flips, at which point it converts into a violent unwind.
The One Signal Algorithms Actually Watch
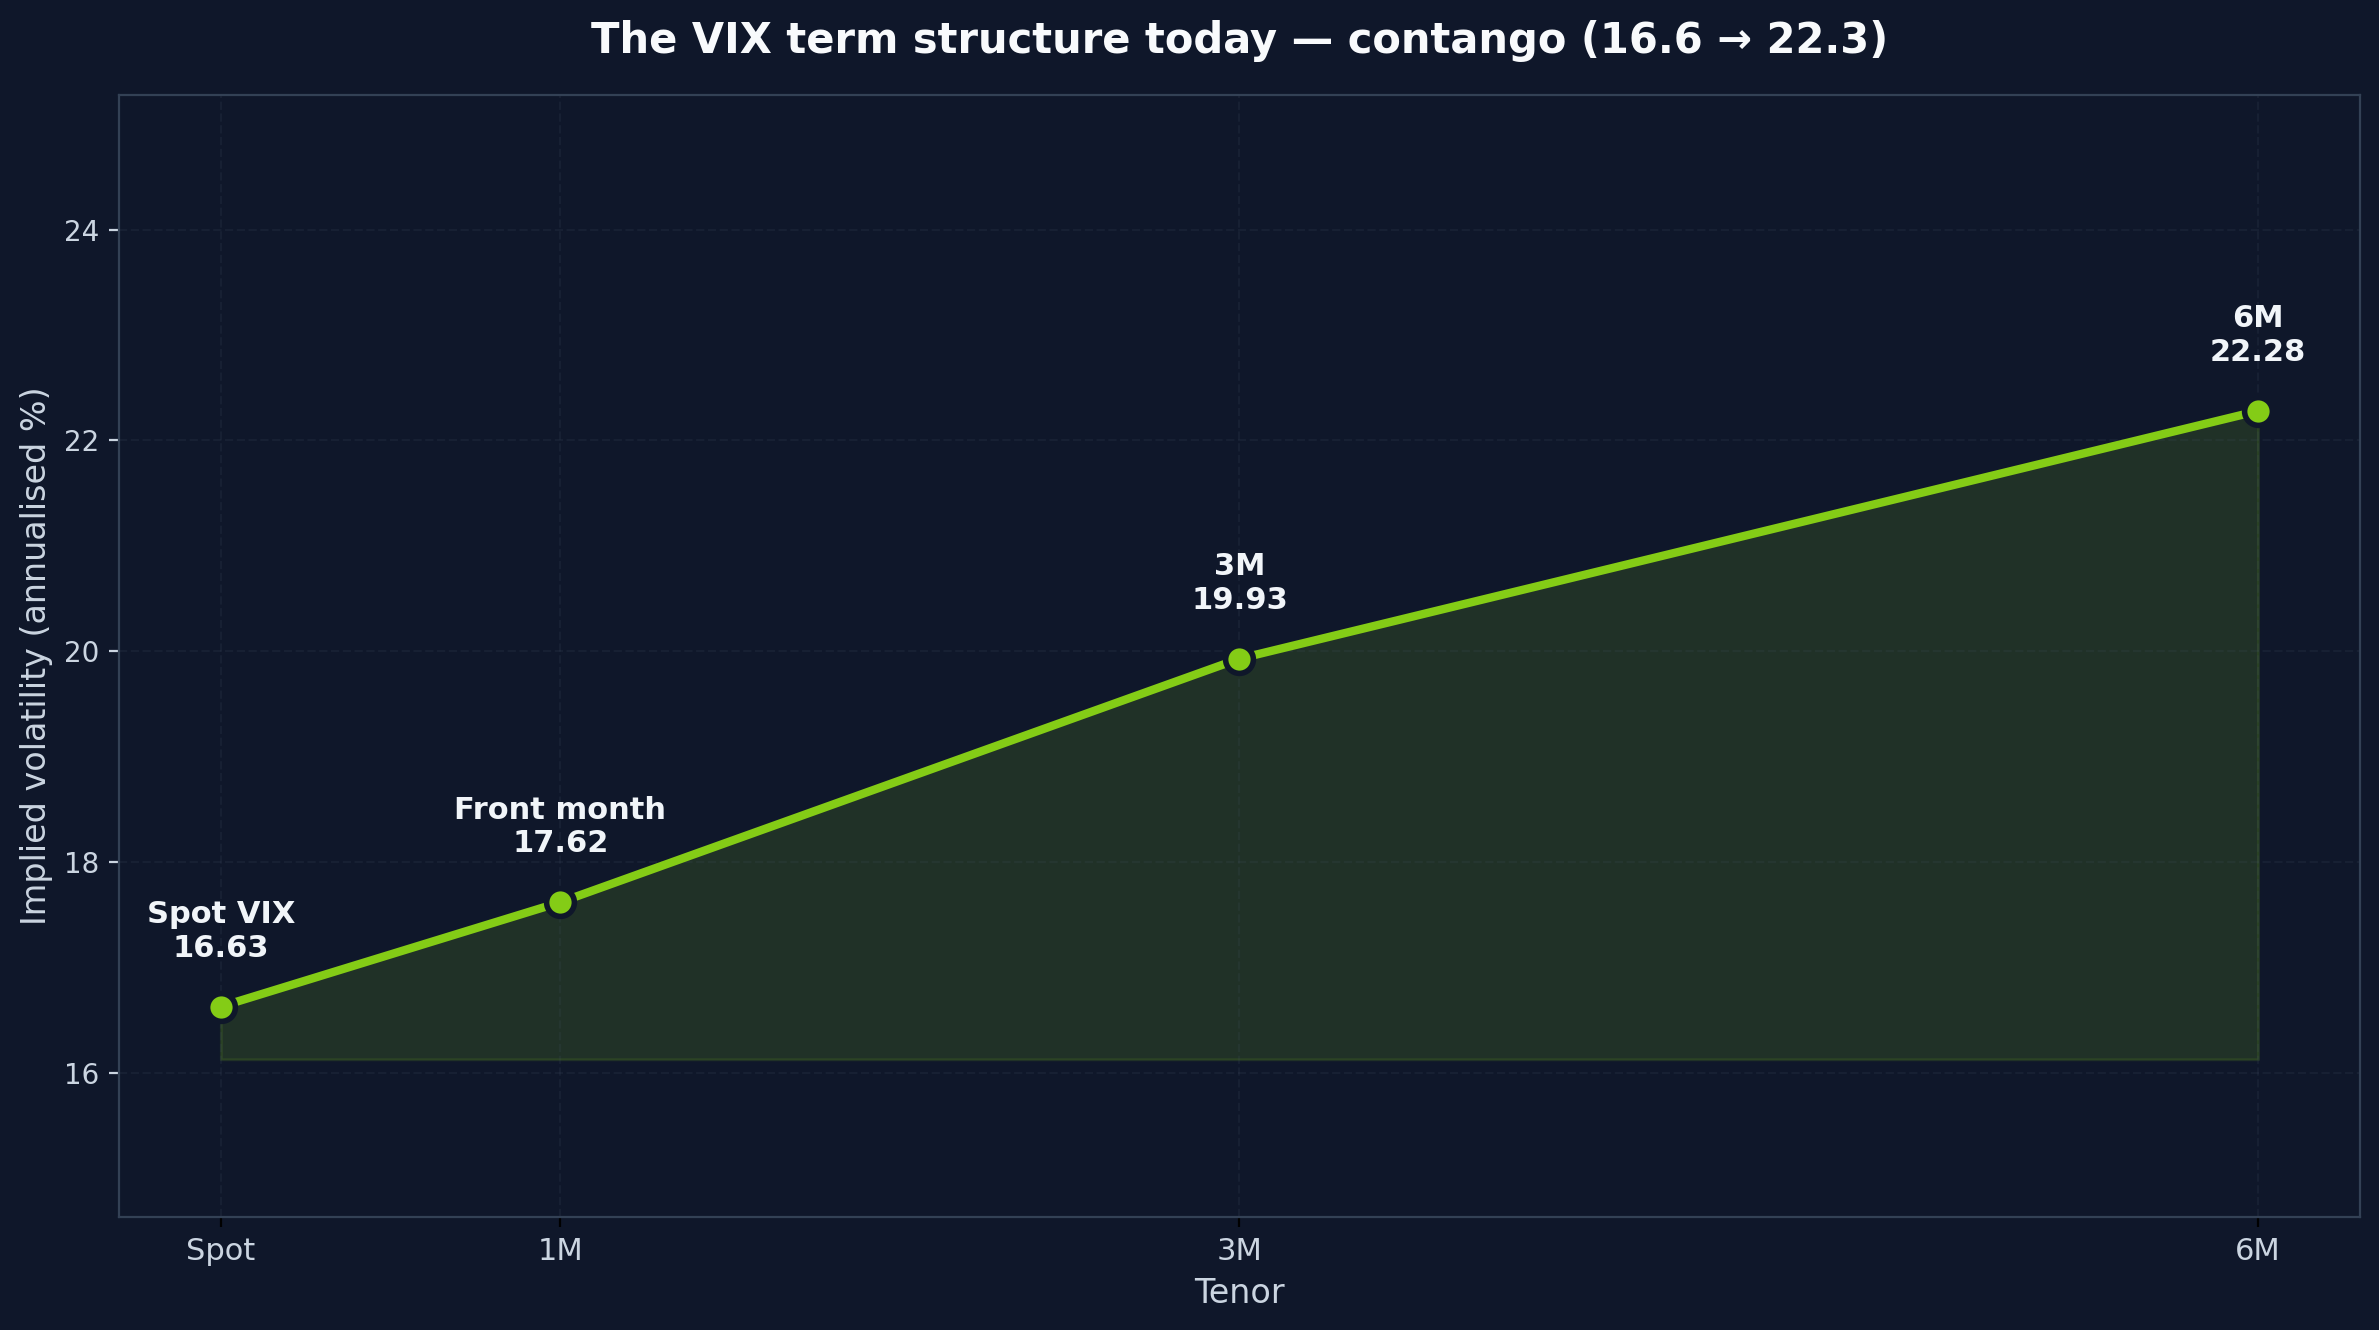
Professional volatility desks do not watch the VIX. They watch a single ratio: VIX divided by VIX3M — the spot index over its three-month equivalent. Below 1.0, the curve is in contango. Above 1.0, it has flipped to backwardation. That’s the whole signal. As of this morning the ratio sits at 0.83 (16.6 over 19.9). Deep contango. The carry is on.
The simplest rule short-volatility strategies run is some version of: be short vol when the ratio is below 1.0; cut exposure when it crosses above. That rule is what saved most disciplined short-vol books in February 2018. The famous casualty, the XIV note from Credit Suisse, didn’t have it. On the evening of February 5, 2018, XIV’s value collapsed roughly 90% in the closing minutes as a violent VIX futures spike triggered a feedback loop with the rebalance demand of leveraged short-vol products. Credit Suisse pulled the plug the next day. Final settlement came on February 15 — roughly $5.99 per share, against a prior close north of $100. Holders were almost entirely wiped out.
That episode is why ProShares restructured both UVXY and SVXY in late February 2018, cutting the leverage from 2x to 1.5x and from −1x to −0.5x respectively. The rebalance flows from the original products had grown large enough to amplify any short-vol panic into a self-reinforcing cascade. The tail risk on short-volatility is not theoretical.
For the positioning side of the algorithmic mechanics, our piece on how to read the COT report walks through the same kind of regime-filter discipline applied to futures positioning rather than the volatility curve.
The Bottom Line
Holding VXX or UVXY as a multi-week “insurance” trade is, mechanically, a losing position. You pay the carry in 80% of sessions, and the 20% you would benefit from clusters in short, late episodes — usually after the equity move that prompted the urge to hedge is mostly done.
Short-dated tactical hedges — a one-to-three day VXX position into a known event like a Fed meeting or a CPI print — can work as event hedges. Multi-week buy-and-hold protection trades almost never do. If you actually want portfolio hedges, simple put options on SPY or longer-dated VIX call spreads are mechanically cheaper than rolling front-month VIX futures through months of contango.
Volatility ETFs are tactical instruments for traders who understand the regime they are trading in. They are not insurance. If you bought one as insurance and held it, you didn’t buy insurance — you bought a melting ice cube. The data is public: the Cboe VIX futures contract specs, the Cboe VIX methodology paper, and the Barclays iPath VXX factsheet. The rebalance rule is in plain English on page two of that last one. Read it once before you ever own the ticker.
Get early access to Orbit
Orbit is Luna3.ai’s AI-augmented research engine. 12 algorithmic signals + a gradient-boosted ML model + an agentic LLM that reads each top pick’s filings and writes a daily thesis with conviction score and catalyst proximity. Three regimes, three playbooks — growth in expansion, defensives in late-cycle, recovery plays at panic bottoms. The 3 in Luna3.ai.
No spam. Unsubscribe any time.
No comments yet. Be the first to share your thoughts!