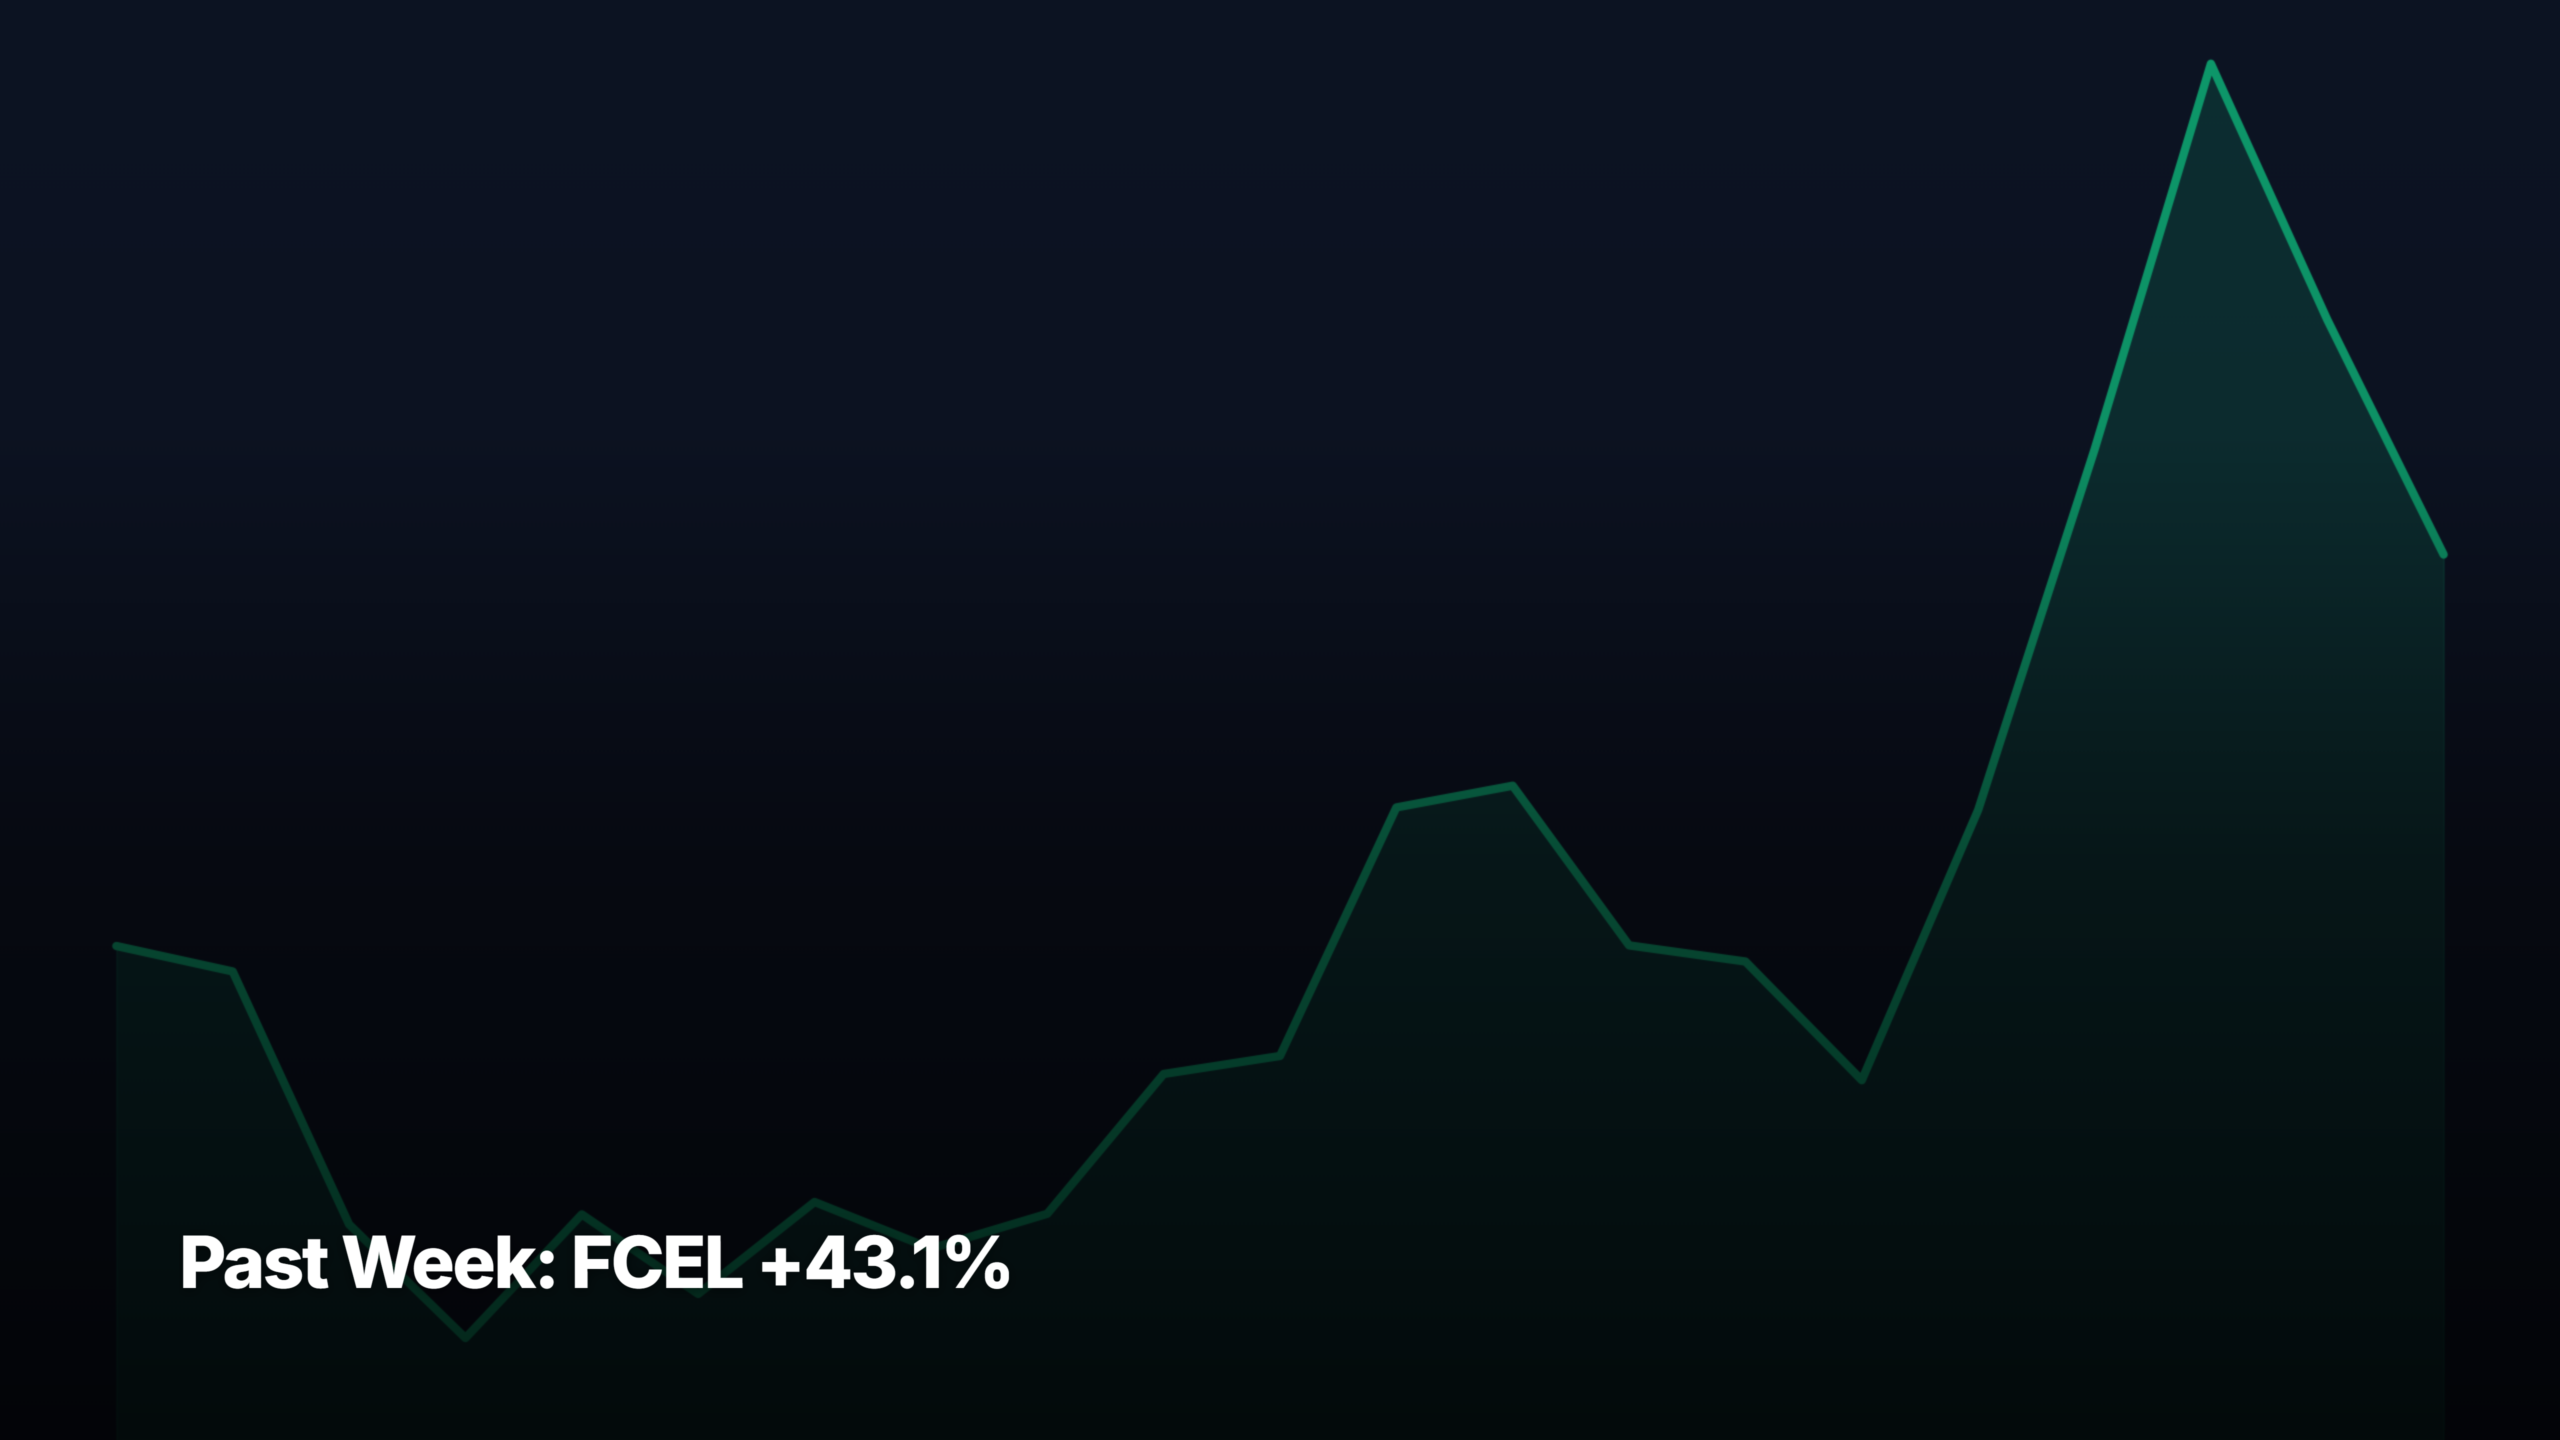
- FCEL +43.1% was the biggest gainer across all cap tiers over the past week through July 2, 2026.
- Top gainer: FCEL +43.1% (mid-cap). Top decliner: CIFR -22.0%.
- Return spread between the biggest gainer and biggest loser across all tiers was 65.0 percentage points — wide dispersion.
These are the top stock movers for the past week through July 2, 2026, broken down by market-cap tier. FCEL +43.1% was the single biggest move across all four tiers. For each tier, the top 3 gainers and top 3 decliners are listed with a plain-English catalyst note and a pattern-recognition read — whether the move looks like a clean breakout, momentum continuation, mean-reversion bounce, or extended run with reset risk.
Universe: ~145 curated US common stocks (NYSE + Nasdaq, ≥$300M market cap, ≥$1M average daily dollar volume). Cap tier reflects current market cap, not historical.
Mega-cap leaders (above $200B market cap)
Top gainers — past week
1. ↑ ADBE +13.60%
$219.72 · avg $1,535M/day · Mega-cap
Why: Sentiment on Adobe flipped this week after HSBC publicly argued the market was mispricing Adobe’s AI positioning, and a notable insider boosted their stake by 130%. Combined with a broader analyst call that software had been unfairly left behind in the AI rotation, buyers stepped back into a name that had lagged.
Pattern: Sharp reversal bounce off a beaten-down base rather than a clean breakout — this is short-covering plus sentiment reset. The move is steep for one week, so near-term reset risk is real if follow-through volume fades.
2. ↑ AAPL +12.17%
$308.63 · avg $29,975M/day · Mega-cap
Why: Apple ripped as the AI rotation broadened back into mega-cap tech, with commentary pointing to Apple closing in on Nvidia for the world’s most valuable company title. Coverage highlighting device pricing power from AI features and technical buy signals helped pull momentum buyers back in.
Pattern: Strong trending advance on heavy dollar volume, riding the mega-cap tech bid. The +12% weekly move is extended for a $3T-scale name, so consolidation odds are elevated even if the underlying trend stays intact.
3. ↑ MSFT +10.67%
$390.49 · avg $28,008M/day · Mega-cap
Why: Microsoft rebounded hard after what coverage called its worst month in over 25 years, with buyers treating the drawdown as a discount rather than a warning. The $2.5B Frontier enterprise-AI launch reinforced that Microsoft’s AI spending is still translating into product, not just capex.
Pattern: Textbook mean-reversion bounce off oversold conditions after a deep monthly decline. The snap-back is powerful but the prior damage hasn’t fully repaired — expect chop as it retests the breakdown zone.
Top decliners — past week
1. ↓ ORCL -8.00%
$140.27 · avg $5,704M/day · Mega-cap
Why: Oracle slipped as investors took profits in a name that had been a heavy AI-infrastructure winner, with coverage now debating whether the cloud outlook fully justifies the multiple. No single hard catalyst — the tape read more like rotation out of the extended AI-capex trade into software laggards like Adobe and Microsoft.
Pattern: Distribution behavior near recent highs — down 8% on no clean negative catalyst suggests supply from stretched positioning. Watch whether it can hold prior support; a lower-high pattern would confirm a trend break.
2. ↓ AVGO -4.87%
$360.45 · avg $10,190M/day · Mega-cap
Why: Broadcom traded softer alongside the broader semi-cap rotation, with attention shifting toward AMD valuation debates and Nvidia positioning rather than Broadcom-specific news. The DriveNets Tomahawk 6 announcement was constructive but didn’t move the tape — this looks like sector-level profit-taking, not a company-specific issue.
Pattern: Mild pullback within an established uptrend — a healthy digestion of prior gains rather than a distribution top. The 5% weekly decline is well within normal semi-cap volatility, no reset signal yet.
3. ↓ WMT -3.40%
$111.84 · avg $3,376M/day · Mega-cap
Why: Walmart drifted lower in a week where money rotated aggressively into AI-tech names, leaving defensives underbid. Retail-sector coverage pointing to weakness at Macy’s and Kohl’s added a mild negative overlay, though Walmart’s own Google Gemini checkout news was neutral-to-positive on fundamentals.
Pattern: Classic risk-on tape underperformance — defensive laggard as capital rotates into high-beta AI winners. The move looks more like relative weakness than absolute breakdown; watch the 200-day for a proper trend read.
Large-cap leaders ($10B to $200B market cap)
Top gainers — past week
1. ↑ PLTR +20.54%
$129.30 · avg $6,361M/day · Large-cap
Why: Palantir surged on the NVIDIA AI collaboration coverage, which framed the tie-up as a potential inflection point for the platform business. Retail popularity metrics reinforced the momentum, with Palantir sitting alongside Nvidia and Tesla in Robinhood-favorite lists — classic momentum-feeds-momentum dynamics.
Pattern: Extended momentum breakout — clean move through prior resistance on the NVDA catalyst. A +20% weekly move at this market cap is aggressive; watch for a pullback to prior breakout level as the first test of trend.
2. ↑ ZS +19.01%
$147.33 · avg $446M/day · Large-cap
Why: Zscaler bounced hard after coverage highlighted its 34% YTD drop and questioned whether recovery conditions were in place — a classic setup where washed-out names catch a bid when the AI-security narrative reasserts. Netskope commentary about AI reshaping SaaS security dragged the whole cohort higher.
Pattern: Sharp mean-reversion bounce off deeply oversold levels — this is a reset trade, not a trend continuation. Sustainability depends on whether the sector-wide security bid holds; low relative dollar volume vs mega-caps makes it thinner and choppier.
3. ↑ NOW +18.77%
$106.32 · avg $2,414M/day · Large-cap
Why: ServiceNow rallied on renewed enterprise-AI enthusiasm, with coverage framing the pullback as a golden entry for patient holders. The broader software-catches-up-to-AI theme that lifted Adobe and Microsoft this week pulled NOW along, though there was no hard company-specific catalyst.
Pattern: Powerful bounce off recent lows — momentum-driven reversion rather than a fresh breakout. Nearly +19% in a week is stretched for a mega-cap software name, so a partial giveback and retest of the reversal zone would be normal.
Top decliners — past week
1. ↓ IREN -18.68%
$38.82 · avg $1,886M/day · Large-cap
Why: IREN gave back gains as the crypto-miner-turned-AI-infrastructure trade cooled off — no single negative catalyst, but the whole cohort (CIFR, RIOT) declined together this week, suggesting broad profit-taking after the group’s prior run. Positive analyst commentary on data-center contracts didn’t offset the tape.
Pattern: Sharp pullback from extended levels within a still-uptrending name — looks like healthy digestion of prior gains, not distribution. The 19% weekly drawdown is severe though; a lower low next week would flip the read to trend damage.
2. ↓ QCOM -13.98%
$176.25 · avg $4,544M/day · Large-cap
Why: Qualcomm broke down after Q1 earnings context left the market questioning growth pace relative to peers, and coverage flagged it as a persistent lagger to the semi group. With money rotating actively within chips (into Broadcom’s ecosystem, out of legacy handset exposure), Qualcomm caught the outflow.
Pattern: Trending decline with follow-through selling — a 14% weekly drop through prior support looks like a genuine trend break, not noise. Needs a stabilization week before any bounce is trustworthy; oversold bounces here can be sharp but short-lived.
3. ↓ INTC -9.42%
$120.35 · avg $14,517M/day · Large-cap
Why: Intel sold off as commentary around SpaceX moving into chip design added a new competitive-narrative overhang, and the broader semi-rotation pulled money away from the turnaround-story names. Positive framing from Jim Cramer about growth opportunities wasn’t enough to stem the outflows.
Pattern: Trending decline extending an already weak setup — this is momentum out, not a technical breakdown from a new level. Heavy dollar volume ($14B/day) means real institutional distribution, which historically takes weeks to fully clear.
Mid-cap leaders ($2B to $10B market cap)
Top gainers — past week
1. ↑ FCEL +43.05%
$28.11 · avg $612M/day · Mid-cap
Why: FuelCell rocketed on a $49M U.S. agency deal that gave the fuel-cell thesis fresh government-backed validation. Back-to-back analyst upgrades reinforced the institutional-support narrative, and the broader Bloom Energy/AI-power tailwind pulled the whole clean-energy-for-datacenters cohort higher.
Pattern: Explosive breakout with catalyst — +43% on a real deal is a legitimate news-driven move, not just squeeze. That said, at this magnitude a pullback of a third to a half of the move is typical before the trend resumes.
2. ↑ FUBO +26.08%
$10.20 · avg $19M/day · Mid-cap
Why: Fubo’s move looks squeeze-driven — no clean fundamental catalyst in the tape, but the stock sits in the unprofitable-media bucket that catches sharp bids on rotation. Q1 earnings context and the broader risk-on tape gave beaten-down small-media names room to run.
Pattern: Sharp low-volume bounce — $19M/day dollar volume means this moves easily on modest flow. Pattern is oversold-reversal, not clean breakout; without follow-through volume, moves like this tend to fade over two to three weeks.
3. ↑ RIVN +25.37%
$18.63 · avg $757M/day · Mid-cap
Why: Rivian rallied on renewed EV cohort interest alongside a Lucid comparison piece and coverage of software-driven revenue potential. Insider selling coverage was a mild overhang, but the tape read as risk-on rotation into beaten-down growth EVs, with Rivian catching most of the flow.
Pattern: Momentum breakout off a long consolidation base — the cleanest chart in this small-mid growth group. If it can hold above the breakout zone next week, this is trend continuation; a fast reversal back into the base would signal it was squeeze.
Top decliners — past week
1. ↓ M -9.53%
$23.25 · avg $143M/day · Mid-cap
Why: Macy’s fell as coverage framed department-store fundamentals as disappointing, with headlines linking it to the same weakness affecting Kohl’s. The tape’s rotation into AI-tech pulled money away from legacy retail even without a Macy’s-specific negative print — classic risk-on cohort punishment.
Pattern: Trending decline continuing a weak setup — no reversal signal yet. The move is orderly rather than climactic, which usually means more downside to come before a proper bottom forms.
2. ↓ KSS -4.71%
$18.19 · avg $97M/day · Mid-cap
Why: Kohl’s traded lower alongside Macy’s on the same disappointing-retail headlines, with no company-specific catalyst but full participation in the department-store weakness theme. Money continued to flow out of struggling brick-and-mortar retail into higher-growth names.
Pattern: Choppy decline near multi-year lows — the move is muted (-5%) which suggests supply is thinning at these levels. Not a clean pattern; more of a slow bleed than a distribution top or breakdown.
3. ↓ ALK -4.13%
$51.09 · avg $178M/day · Mid-cap
Why: Alaska Air declined despite Goldman and TD Cowen raising targets on peer airlines — the sector call didn’t translate into buying at Alaska specifically. No single clear catalyst; the tape read like relative-rotation weakness within airlines, with money favoring the larger-cap names the analysts named directly (Delta, United).
Pattern: Mild pullback within a range — not a breakdown, not a breakout. The 4% weekly move is unremarkable at this cap tier and doesn’t tell you much about direction; wait for a decisive close outside the recent range.
Small-cap leaders ($300M to $2B market cap)
Top gainers — past week
1. ↑ ASTS +29.73%
$85.13 · avg $1,913M/day · Small-cap
Why: AST SpaceMobile jumped on a $926M funding round anchored by Rakuten Ventures for the Japan network buildout — a real deal that both validated the business model and removed capital-raise overhang. Retail investor interest in space-plays outside of SpaceX added a momentum tailwind.
Pattern: Breakout rally on legitimate news catalyst — momentum plus positive fundamental change. Given the June drawdown context (down 21.6%), this looks like an oversold name catching a real catalyst; sustainable if funding narrative holds, vulnerable to profit-taking short-term.
2. ↑ MVIS +22.58%
$0.38 · avg $8M/day · Small-cap
Why: MicroVision moved on no visible catalyst in the news tape — moves like this at sub-$1 are typically retail-momentum, penny-stock cohort rotation, or short-covering rather than fundamental. Without a clear driver, treat the +23% as noise rather than signal.
Pattern: Low-quality bounce in a penny-stock — high percentage moves on thin dollar volume ($8M/day) are structurally common and rarely persist. This is speculation, not a chart pattern worth reading.
3. ↑ GLSI +20.02%
$22.00 · avg $4M/day · Small-cap
Why: Greenwich LifeSciences advanced on no visible catalyst in the tape — biotech moves at this size ($4M/day dollar volume) are frequently driven by anticipation of pipeline milestones or short-covering rather than confirmed news. Without a clear driver in headlines, this looks like positioning ahead of expected events.
Pattern: Thin-volume advance in a small biotech — the pattern is more about float dynamics than technical structure. Real trend reads require materially more dollar volume; treat this as speculative move until a catalyst confirms it.
Top decliners — past week
1. ↓ CIFR -21.96%
$20.04 · avg $660M/day · Small-cap
Why: Cipher Mining sold off with the broader crypto-miner-turned-AI-infrastructure cohort (IREN, RIOT all down together), suggesting group-level profit-taking after the theme’s prior run. Funding-round coverage didn’t stop the outflow, and the crypto-linked exposure adds cyclicality when momentum reverses.
Pattern: Sharp pullback from extended levels — the whole cohort moving together points to sector rotation, not company-specific damage. Watch whether the group finds support next week; without it, more downside likely.
2. ↓ KEEL -21.81%
$4.59 · avg $318M/day · Small-cap
Why: Keel Infrastructure gave back gains despite coverage highlighting the pivot from Bitcoin mining to AI infrastructure and a Wall Street piece flagging potential upside from Russell 3000 inclusion. The decline moved with the broader crypto-miner cohort weakness — sector rotation overwhelmed the constructive coverage.
Pattern: Sharp reset from extended levels within a still-active narrative — pattern is cohort-driven pullback, not distribution top. Sustainability of the AI-infrastructure pivot thesis matters more than this week’s price action for the multi-week read.
3. ↓ RIOT -20.35%
$22.11 · avg $547M/day · Small-cap
Why: Riot Platforms fell with the miner cohort (CIFR, IREN, KEEL) in what looks like coordinated profit-taking on the crypto-to-AI-datacenter trade. Analyst commentary framing the data-center business as having further upside didn’t offset the group-level outflow — a reminder that cohort behavior often dominates single-name news.
Pattern: Trending decline extending prior weakness — the move is severe (-20%) and consistent with the group. Not a reversal setup yet; needs the whole miner cohort to stabilize before individual names can bottom.
What the past week cohort tells us
The clear leadership this week came from mega-cap and large-cap software (Adobe +14%, Microsoft +11%, Palantir +21%, ServiceNow +19%, Zscaler +19%) — a distinct rotation into the software names that had been left behind in the earlier AI-infrastructure trade. That’s significant because it suggests the AI story is broadening from picks-and-shovels (chips, power, datacenters) into application-layer software, a healthier setup than a narrow leadership tape. The macro read is risk-on but rotating: crypto-miners-turned-AI-infrastructure (CIFR, RIOT, KEEL, IREN) all sold off 18-22%, and semi-legacy names (Qualcomm -14%, Intel -9%) broke down — money is leaving the crowded AI-hardware trade to chase software laggards. Defensives (Walmart) underperformed and legacy retail (Macy’s, Kohl’s) declined, confirming the risk-on tilt. Return dispersion is wide (FCEL +43% versus CIFR -22% is a 65-point spread), which historically signals a market working through a rotation rather than trending uniformly. Forward-looking: watch whether the AI-infrastructure cohort stabilizes next week — if it doesn’t, the software-rotation thesis strengthens; if it snaps back hard, this week was profit-taking noise inside an unchanged leadership regime.
Bottom line
The top stock movers recap covers every US market-cap tier from mega ($200B+) to small ($300M-$2B). The Past Week view shows sustained leadership and sector rotation — complementary to the daily session recap (single-session moves, Tue-Sat morning Melbourne time).
Get early access to Orbit
Orbit is Luna3.ai’s AI-augmented research engine. 12 algorithmic signals + a gradient-boosted ML model + an agentic LLM that reads each top pick’s filings and writes a daily thesis with conviction score and catalyst proximity. Three regimes, three playbooks — growth in expansion, defensives in late-cycle, recovery plays at panic bottoms. The 3 in Luna3.ai.
No spam. Unsubscribe any time.
No comments yet. Be the first to share your thoughts!