
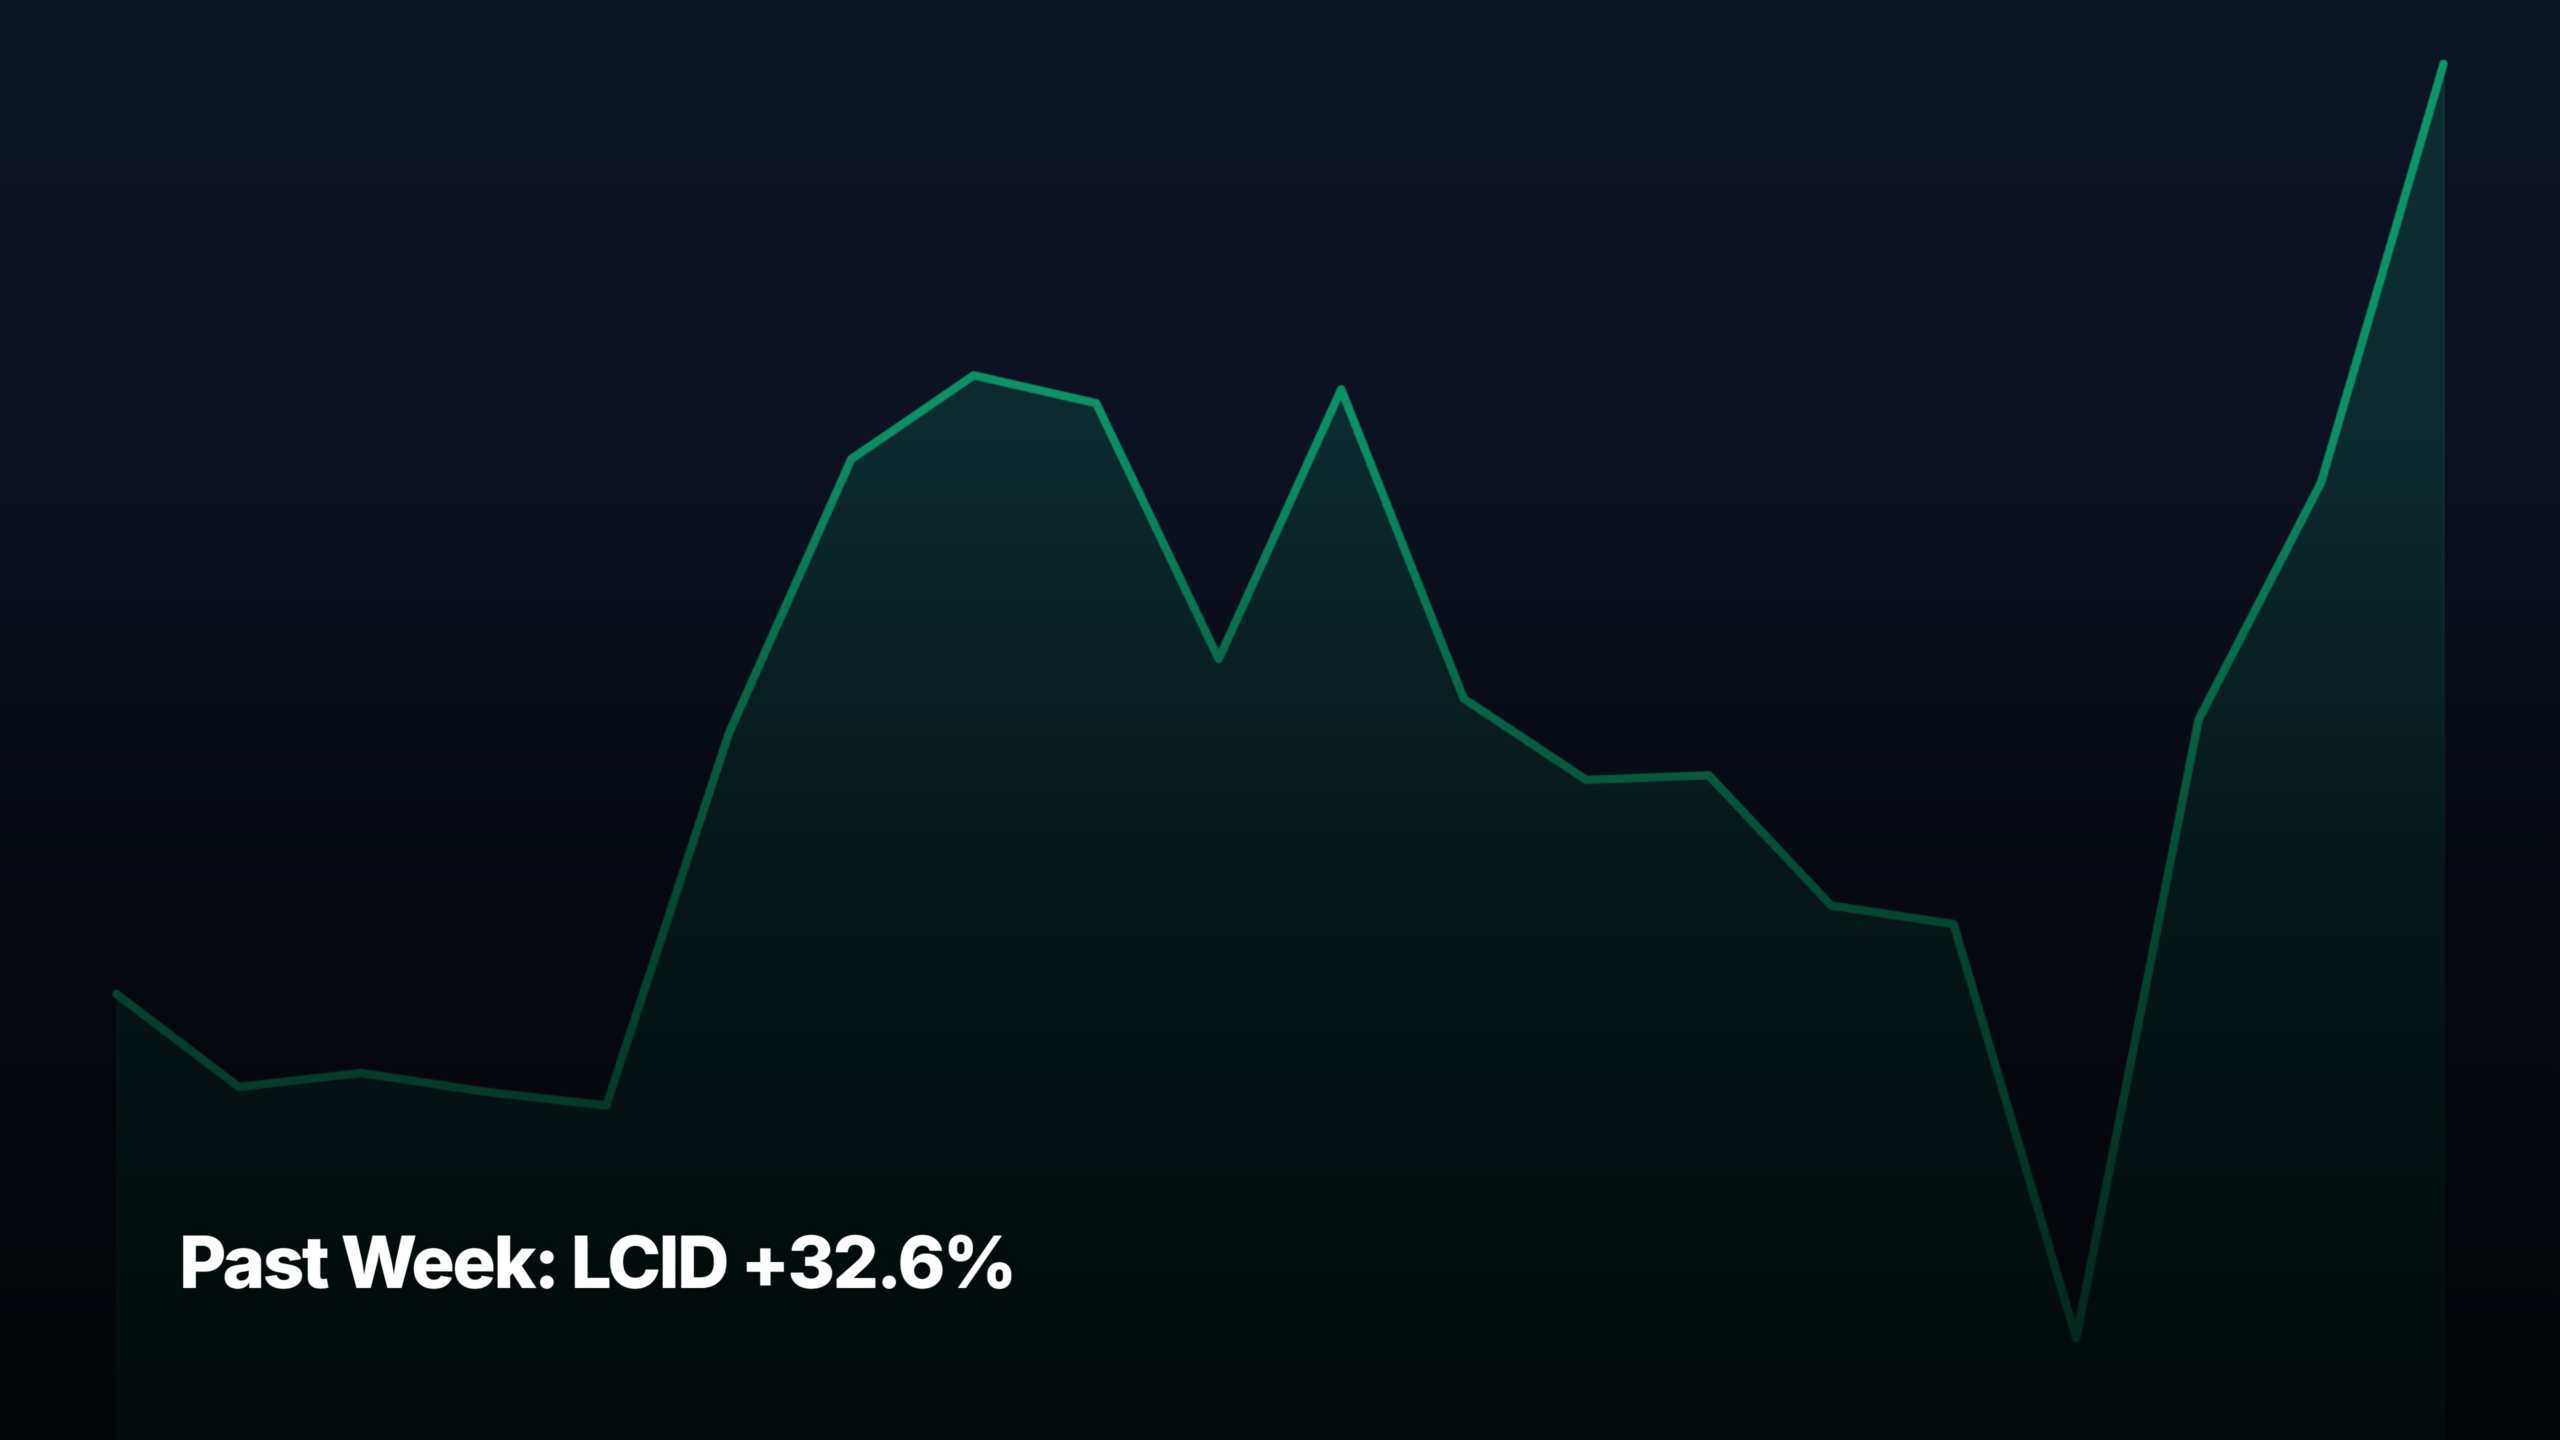
- LCID +32.6% was the biggest gainer across all cap tiers over the past week through July 17, 2026.
- Top gainer: LCID +32.6% (mid-cap). Top decliner: IBM -26.0%.
- Return spread between the biggest gainer and biggest loser across all tiers was 58.7 percentage points — wide dispersion.
These are the top stock movers for the past week through July 17, 2026, broken down by market-cap tier. LCID +32.6% was the single biggest move across all four tiers. For each tier, the top 3 gainers and top 3 decliners are listed with a plain-English catalyst note and a pattern-recognition read — whether the move looks like a clean breakout, momentum continuation, mean-reversion bounce, or extended run with reset risk.
Universe: ~145 curated US common stocks (NYSE + Nasdaq, ≥$300M market cap, ≥$1M average daily dollar volume). Cap tier reflects current market cap, not historical.
Mega-cap leaders (above $200B market cap)
Top gainers — past week
1. ↑ CVX +6.22%
$187.38 · avg $1,264M/day · Mega-cap
Why: Energy caught a bid this week as investors rotated out of semiconductors and AI names into defensives with real cash flow. Chevron also picked up specific headlines around Iraq production growth alongside ConocoPhillips, giving the rally a fundamental hook rather than pure rotation. The move stands out against a down week for the broader S&P 500.
Pattern: Clean breakout from a multi-week base with steady daily gains rather than a single gap. Trend looks constructive but not extended — no exhaustion candle yet. Room to run if the rotation into energy continues, though a pullback to test the breakout level would be normal.
2. ↑ XOM +6.11%
$147.36 · avg $2,352M/day · Mega-cap
Why: Exxon rode the same defensive-rotation trade as Chevron, with the Iraq production-growth angle providing a shared catalyst for the majors. A Zacks top-report feature added a modest attention boost. In a week where AI leaders sold off hard, integrated oil names became the obvious risk-off parking spot inside equities.
Pattern: Momentum continuation with above-average dollar volume — the $2.35B daily turnover shows real institutional participation, not just retail chasing. Move is orderly and trend-aligned. Slightly extended near-term but the base structure underneath is intact enough that a small dip likely gets bought.
3. ↑ ADBE +6.09%
$237.25 · avg $1,299M/day · Mega-cap
Why: Adobe bounced off deeply oversold levels as bargain-hunters worked through the software wreckage — one of the trade headlines this week was literally about finding value in beaten-down software names. No fresh company-specific catalyst, more a mean-reversion trade after the group had been left for dead versus AI-native competitors.
Pattern: Mean-reversion bounce off a well-defined support zone rather than a base breakout. Rally is credible but needs follow-through volume to confirm a real trend change. Until it clears prior resistance, treat this as a relief move inside a longer downtrend rather than a new leg up.
Top decliners — past week
1. ↓ AMD -11.14%
$495.76 · avg $13,427M/day · Mega-cap
Why: AMD got caught in the broad AI semiconductor rout that dominated the week’s tape, with the group selling off on renewed worries about AI capex sustainability and Middle East risk. No AMD-specific negative headline — this was cohort selling, and AMD’s higher beta inside the group amplified the move on the way down.
Pattern: Sharp distribution week on heavy $13.4B daily volume — this is real selling, not noise. Break of near-term support opens downside toward the prior consolidation zone. Reset potential is genuine; wait for volume to dry up and a base to form before assuming the AI trade is back.
2. ↓ ORCL -10.12%
$126.41 · avg $6,335M/day · Mega-cap
Why: Oracle sold off as the AI-infrastructure trade unwound and Jim Cramer’s on-air call that ORCL is ‘going down’ hit sentiment. The SpaceX-Pentagon AI-compute headline also reminded investors that hyperscaler AI wins are not exclusive to Oracle, denting the neocloud premium the stock had built up.
Pattern: Distribution top after a strong run — this is the classic pattern of a leadership name losing its bid. Heavy volume on the down days, weak bounces. Trend break is clear enough that near-term momentum longs should respect the damage; base rebuilding takes weeks not days.
3. ↓ AVGO -7.29%
$370.83 · avg $7,934M/day · Mega-cap
Why: Broadcom followed AMD and Nvidia lower in the AI-selloff wave, with the group repricing after weeks of extended gains. No Broadcom-specific news — this was cohort compression as investors trimmed AI-linked semis broadly. AVGO’s mega-cap status limited the damage relative to smaller AI names but didn’t spare it entirely.
Pattern: Trending decline that broke through the shorter-term moving average. Structure still constructive on a longer view, but the past-week action looks like the start of a proper pullback rather than a one-day wobble. Watch prior breakout level as first support test.
Large-cap leaders ($10B to $200B market cap)
Top gainers — past week
1. ↑ PYPL +22.11%
$56.56 · avg $1,892M/day · Large-cap
Why: PayPal jumped on news the board views a $53B Stripe-Advent bid as too low — an M&A signal that put a firm floor under the stock and forced shorts to cover. A concrete takeover-premium narrative in a week where most large caps had nothing but macro headwinds made PYPL the standout large-cap gainer.
Pattern: Gap-and-go on M&A news — momentum extension driven by a discrete catalyst rather than base breakout. Move is extended near-term and prone to give back some of the pop if a formal bid doesn’t materialize quickly. Deal-arb setup now, not a clean chart trade.
2. ↑ CRWD +8.49%
$203.08 · avg $1,939M/day · Large-cap
Why: CrowdStrike caught a bid as cybersecurity was one of the few software subgroups holding up while AI-infrastructure names sold off. Multiple comparison pieces framing CRWD favorably against Nvidia and Dell reinforced the group’s defensive-growth positioning in a risk-off week for tech.
Pattern: Clean base-and-breakout on healthy volume — pattern looks constructive with room before extension. Rally is orderly, not parabolic. If broader tape stabilizes, CRWD has the structure to keep trending; if the software group rolls, this becomes the first mean-reversion candidate.
3. ↑ ZS +7.66%
$149.94 · avg $363M/day · Large-cap
Why: Zscaler rode the same defensive-cybersecurity rotation as CrowdStrike, with Jim Cramer’s five-best-cybersecurity list adding a retail attention layer. Cybersecurity keeps benefiting from the read-across that AI adoption expands the attack surface, making the group a preferred parking spot when hyperscaler AI stocks wobble.
Pattern: Momentum continuation inside a broader uptrend. Lower dollar volume than mega-cap peers means moves can be choppier, but the past-week structure is clean. Not yet extended — reasonable base still visible on the chart, room for a further leg if group leadership persists.
Top decliners — past week
1. ↓ IBM -26.04%
$212.67 · avg $5,957M/day · Large-cap
Why: IBM had its worst week in memory, described in headlines as an ‘epic fall’ with the company facing a long road back to relevance. The context suggests earnings-driven or guidance-driven damage that shifted the narrative from AI-adjacent turnaround to structural questions. This was single-name capitulation, not just cohort selling.
Pattern: Distribution collapse — a -26% weekly move on $6B daily volume is textbook institutional exit. Chart damage is severe; expect a base-building phase measured in months, not weeks. Bounce attempts likely get sold. This is not a bottom-fishing setup until volume dries up and a proper reversal candle forms.
2. ↓ IREN -18.28%
$33.62 · avg $1,387M/day · Large-cap
Why: IREN got crushed as the neocloud AI-data-center trade unraveled, with CoreWeave down 35% and Nebius sliding 13% in the same cohort selloff. IREN is directly exposed to the same investor thesis, so when the group repriced, high-beta names like IREN took the biggest hit despite no company-specific bad news.
Pattern: Sharp trend break after an extended run — the -41% monthly context tells you this is not a one-week wobble but a broader unwind. Volume-heavy decline suggests real position liquidation. Reset potential is high; wait for the group to stabilize before assuming any bounce holds.
3. ↓ INTC -13.47%
$95.04 · avg $10,904M/day · Large-cap
Why: Intel got dragged into the semiconductor rout alongside AMD and Broadcom, with the added overhang of upcoming earnings looming as investors preemptively cut exposure. No fresh Intel-specific catalyst — this was group derisking ahead of a heavy AI-earnings week where Intel’s execution narrative remains fragile.
Pattern: Trending decline that took out short-term support on heavy $10.9B volume. Chart looks vulnerable heading into earnings — any negative guide risks accelerating the move. Not a clean base yet; treat further downside as more likely than a snapback until earnings clear the overhang.
Mid-cap leaders ($2B to $10B market cap)
Top gainers — past week
1. ↑ LCID +32.61%
$7.36 · avg $348M/day · Mid-cap
Why: Lucid ripped 32% in a low-float momentum move with headlines noting it left Tesla and Rivian behind. No single catalyst dominated — this looks like short-covering plus retail momentum-chasing in an EV name that had been left for dead. One headline flagged the cash position as the shared thread with Amazon and SpaceX.
Pattern: Extended parabolic move — three straight up days into a 32% weekly rally is the definition of momentum extension. Near-term reset potential is very high; these moves rarely hold without a real fundamental hook. Chase risk far outweighs breakout follow-through here.
2. ↑ BILL +8.10%
$44.71 · avg $115M/day · Mid-cap
Why: BILL Holdings gained on renewed value-buyer interest, with multiple Simply Wall Street-style pieces flagging it as below fair value with an embedded-finance narrative. The stock also appeared in a ‘skyrocket’ list alongside Marqeta and Upland, suggesting a small-cap fintech rotation on the day.
Pattern: Constructive bounce off a support zone with reasonable follow-through. Not yet a confirmed breakout — needs to clear the prior lower-high before the trend changes. Lower dollar volume ($115M) means the move is more retail-flow driven than institutional, so watch for fade risk.
3. ↑ FUBO +5.88%
$9.72 · avg $16M/day · Mid-cap
Why: FuboTV drifted modestly higher with no significant catalyst-specific news in the window. This looks like general small-cap streaming-sector positioning rather than a company-specific move. In a week where mega caps sold off, small-cap beta names sometimes catch bids on rotation flows without any real fundamental driver.
Pattern: Low-volume drift higher inside a broader consolidation. Not a base breakout — more of a quiet mark-up. Without volume expansion, the move lacks conviction and could reverse on any negative broader-tape day. Watch for volume to confirm any real trend change.
Top decliners — past week
1. ↓ FCEL -12.05%
$18.50 · avg $241M/day · Mid-cap
Why: FuelCell sold off despite a headline touting a deal that ‘could finally turn it profitable’ — the market clearly didn’t believe the setup. Bloom Energy’s billion-dollar AI deal getting a ‘brutal welcome’ shows the fuel-cell cohort broadly is being sold on execution concerns, and FCEL got dragged along with the peer group.
Pattern: Trending decline that broke the recent range. The gap between headline sentiment and price action is a bearish tell — good news sold. Chart shows distribution more than accumulation. Reset likely needs the group to stabilize before any FCEL-specific bottom can form.
2. ↓ HOOD -10.73%
$99.96 · avg $2,437M/day · Mid-cap
Why: Robinhood sold off despite Goldman raising its price target ahead of earnings — another case of positive news getting sold. The rotation headline about money leaving megacap tech was framed as a positive for HOOD but the stock still gave up ground, suggesting broader risk-off flows overrode the specific bull case this week.
Pattern: Sharp pullback from extended highs on heavy $2.4B volume — profit-taking pattern after a strong run. Not yet a trend break, more of a reset within an uptrend. Watch how it acts around earnings — if it holds this pullback zone, base could form; if it breaks, more downside opens.
3. ↓ BYND -9.89%
$0.59 · avg $18M/day · Mid-cap
Why: Beyond Meat continued its slow bleed toward penny-stock territory, with the only news being a protein-drink product line — a strategic pivot that reads more like desperation than growth. At sub-$1, the stock is trading on survival questions, not fundamentals, and the market keeps voting no confidence.
Pattern: Trending decline extending into terminal-value territory. Below $1 the chart mechanics change — moves are dominated by algo activity and delisting-risk headlines rather than any real base structure. Not a bottom-fishing setup until either bankruptcy clarity or a real strategic reset emerges.
Small-cap leaders ($300M to $2B market cap)
Top gainers — past week
1. ↑ GME +0.97%
$21.89 · avg $63M/day · Small-cap
Why: GameStop was nearly flat on the week, with the Uber Eats delivery-partnership headline giving a brief bid that faded as analysts flagged the bull case was already priced in. The ‘survived the trap screen, the growth didn’t’ headline captures the market’s read — meme-era optics without underlying growth traction.
Pattern: Range-bound consolidation with no clear directional break. The chart is in a low-volatility drift phase, waiting for a catalyst to resolve. Neither breakout nor breakdown structure — treat as untradeable on the pattern alone until a decisive move takes it out of the range.
Top decliners — past week
1. ↓ MVIS -21.79%
$0.30 · avg $3M/day · Small-cap
Why: MicroVision sold off as its ‘Lidar 2.0’ pitch and maintained 2026 revenue outlook failed to convince investors. At $0.30 the stock trades on delisting-risk math, not fundamental value, and the maintained guide was interpreted as tacit acknowledgment that nothing has actually improved on the execution side.
Pattern: Trending decline into sub-$1 territory — same terminal-value dynamics as BYND. Low $3M dollar volume means moves are erratic and driven by retail speculation rather than institutional positioning. Not a real chart setup until either a reverse split or a genuine business inflection happens.
2. ↓ ASTS -21.17%
$57.80 · avg $1,447M/day · Small-cap
Why: AST SpaceMobile got hit hard despite headlines noting reasons the stock had ‘raced higher’ earlier — this looks like profit-taking after an extended run in a name that had become a crowded high-beta space trade. Comparison pieces versus Archer Aviation and ‘cheap enough to buy’ framing suggest the correction was position-driven rather than news-driven.
Pattern: Sharp mean-reversion pullback on heavy $1.4B volume — the kind of move you see when a crowded trade unwinds. Chart is extended in both directions this year; this week’s damage takes it back toward a prior consolidation zone. Reset potential exists but volatility remains elevated.
3. ↓ CIFR -20.58%
$17.56 · avg $384M/day · Small-cap
Why: Cipher Mining fell hard as the AI-data-center bitcoin miner cohort got repriced alongside IREN and other neocloud names. Headlines flagged CIFR as potentially overvalued on its AI-lease revenue shift, and the group-wide unwind of the AI-infrastructure trade caught anything with a data-center storyline attached to it.
Pattern: Group-driven distribution move — CIFR broke lower with the cohort, not on its own catalyst. Trending decline that reset the chart back to the prior base zone. Downside momentum still active; wait for the AI-infrastructure group to stabilize before any bottom call has a chance of working.
What the past week cohort tells us
The week’s most striking feature was the tier inversion: mid-caps produced the biggest winner (LCID +32.6%) and large-caps the biggest loser (IBM -26%), while mega-caps stayed narrowly clustered. Leadership rotated away from AI-infrastructure into defensive value — energy majors CVX and XOM led the mega-cap tape while AMD, ORCL, AVGO, and INTC all took double-digit hits. That is a clear risk-off signal inside equities: growth-to-value, AI-heavy to cash-flow-heavy, high-beta to defensive. The neocloud/AI-data-center cohort (IREN, CIFR, IBM) unwinding together confirms this was thematic derisking, not random single-name news. Return dispersion is very wide — from LCID +32% to IBM -26% is roughly 60 percentage points — which typically signals a regime transition rather than a stable trend, with investors rebuilding positioning around a new narrative. Small caps offered no directional signal (GME barely moved, several declined). Forward observation: with mega-cap AI leadership breaking and defensive-value stepping up, the coming earnings season becomes the referee — if hyperscalers guide capex lower, this week’s rotation likely extends; if they reaffirm, this looks like a healthy shakeout inside a still-intact AI trend.
Bottom line
The top stock movers recap covers every US market-cap tier from mega ($200B+) to small ($300M-$2B). The Past Week view shows sustained leadership and sector rotation — complementary to the daily session recap (single-session moves, Tue-Sat morning Melbourne time).
Get early access to Orbit
Orbit is Luna3.ai’s AI-augmented research engine. 12 algorithmic signals + a gradient-boosted ML model + an agentic LLM that reads each top pick’s filings and writes a daily thesis with conviction score and catalyst proximity. Three regimes, three playbooks — growth in expansion, defensives in late-cycle, recovery plays at panic bottoms. The 3 in Luna3.ai.
No spam. Unsubscribe any time.
No comments yet. Be the first to share your thoughts!