
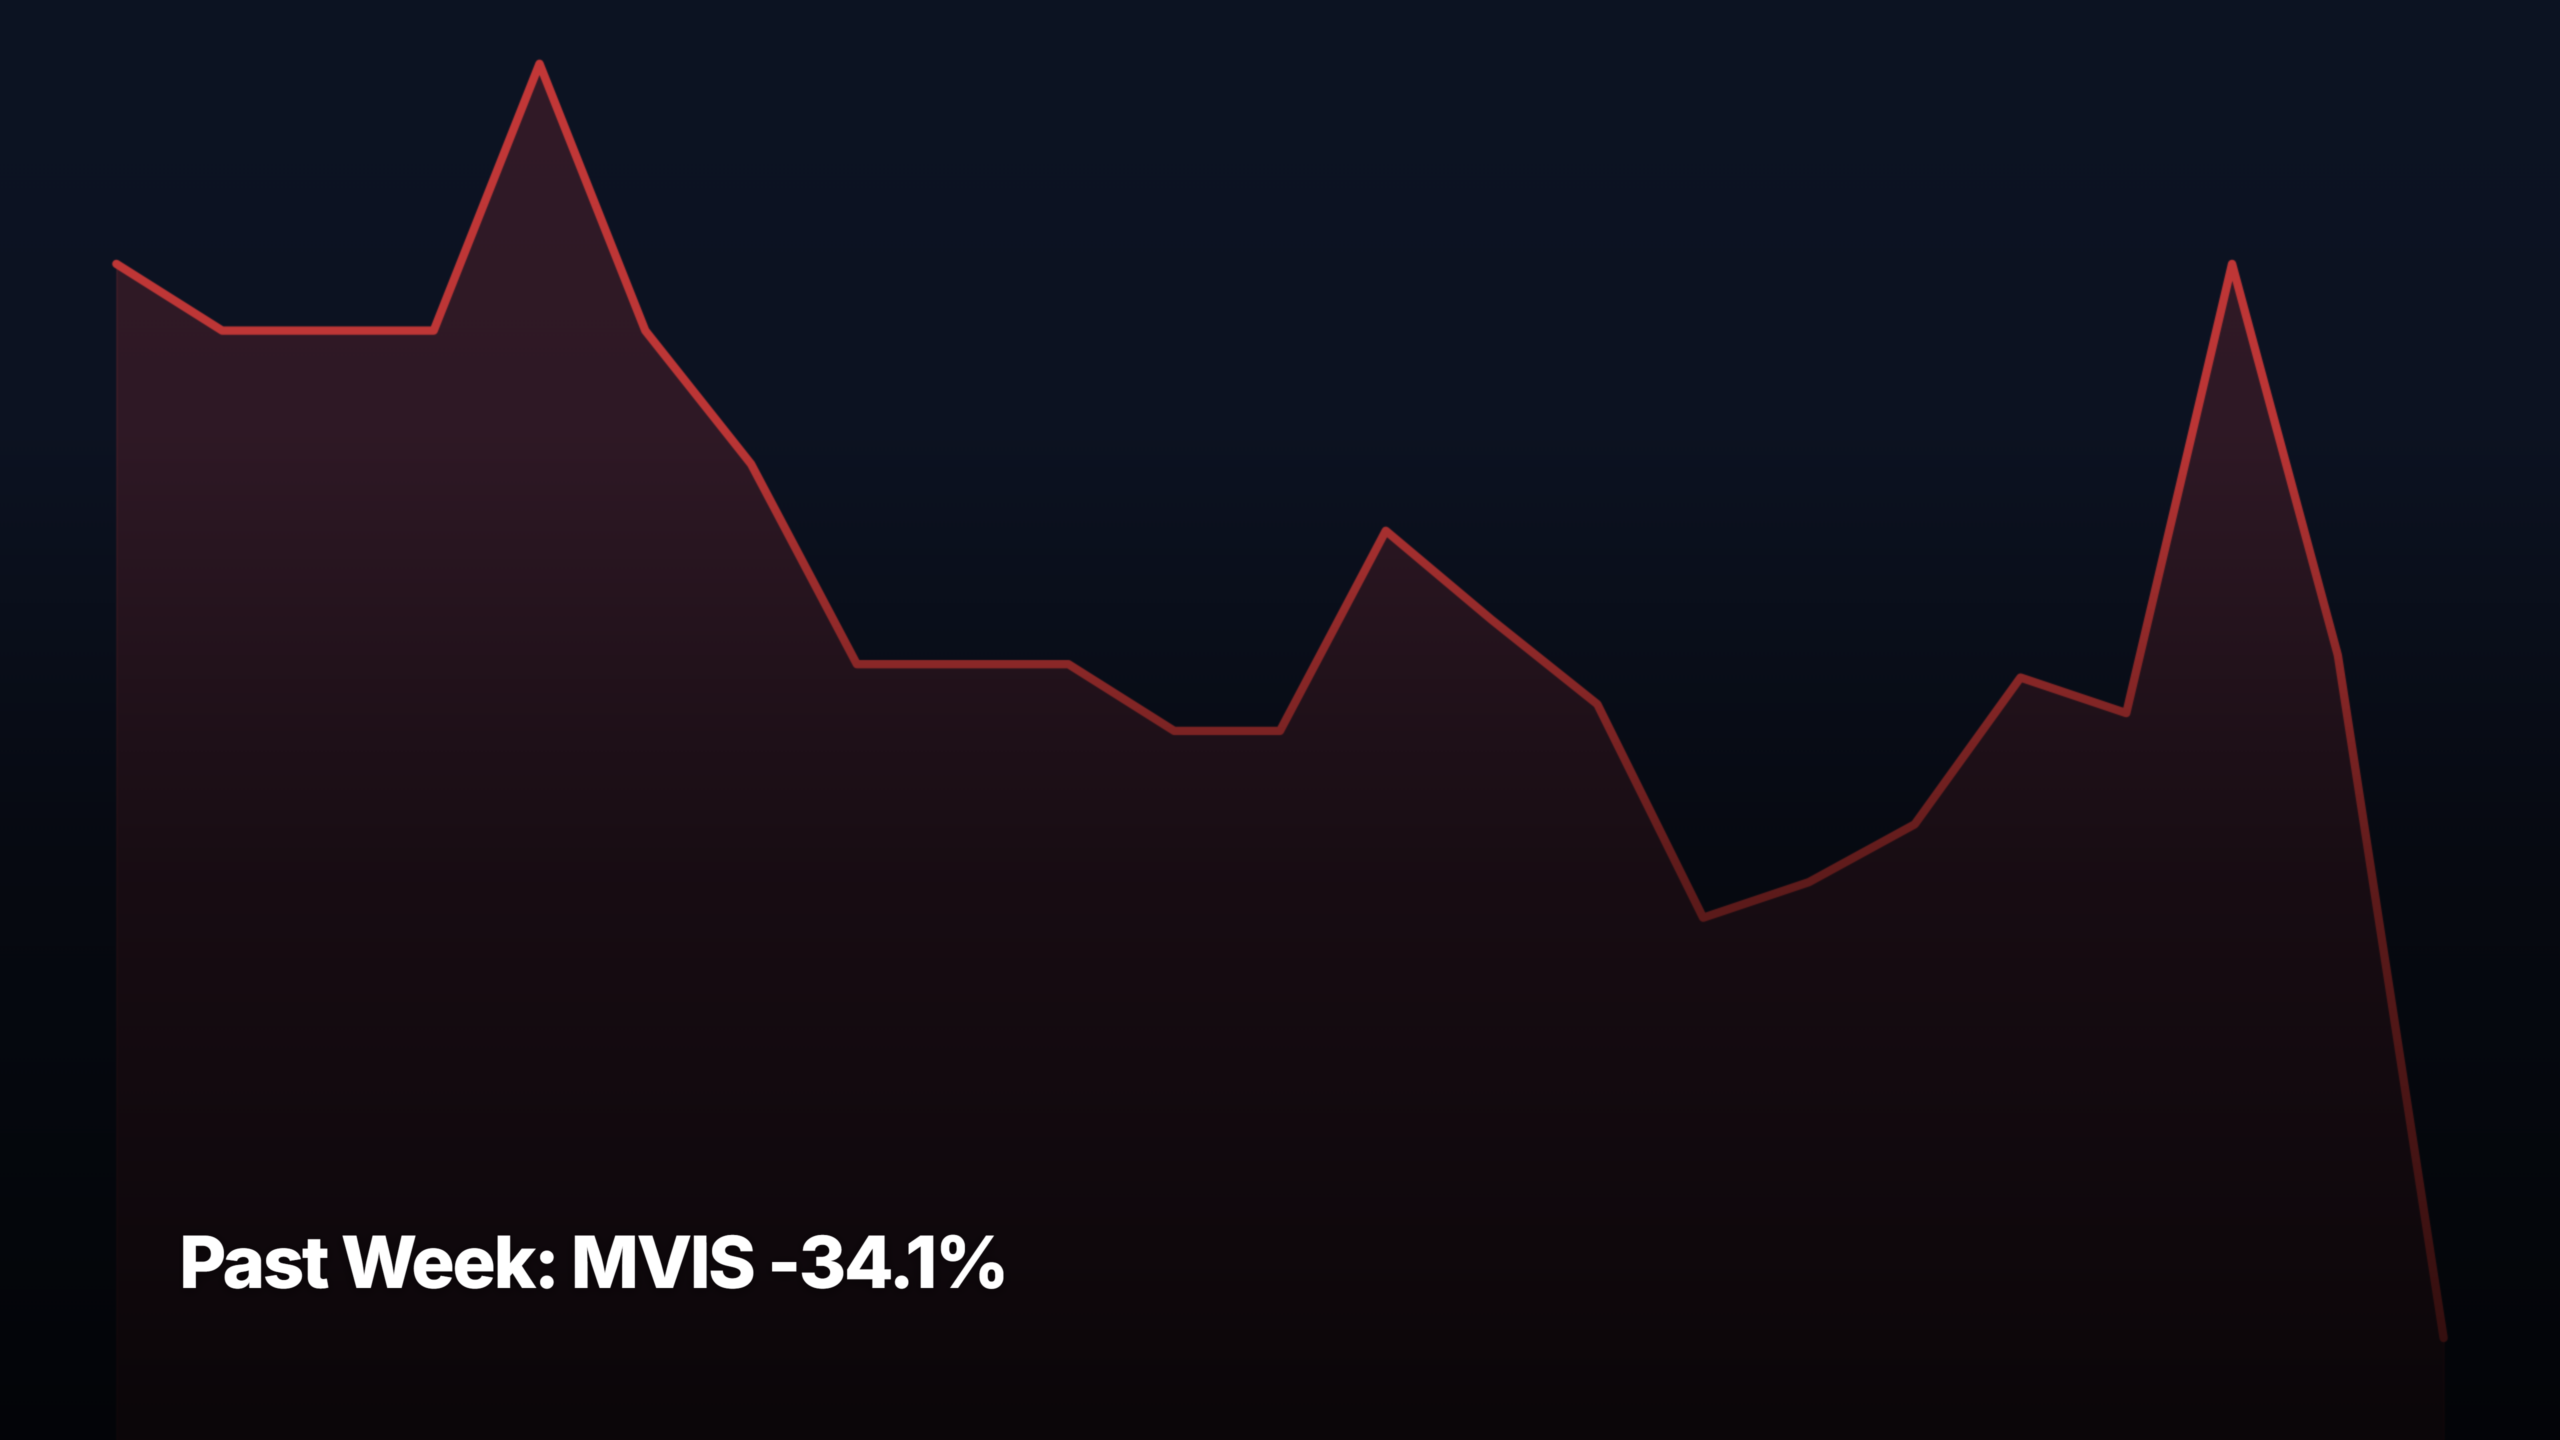
- MVIS -34.1% was the biggest decliner across all cap tiers over the past week through August 14, 2026.
- Top gainer: ACHR +18.4% (small-cap). Top decliner: MVIS -34.1%.
- Return spread between the biggest gainer and biggest loser across all tiers was 52.5 percentage points — wide dispersion.
These are the top stock movers for the past week through August 14, 2026, broken down by market-cap tier. MVIS -34.1% was the single biggest move across all four tiers. For each tier, the top 3 gainers and top 3 decliners are listed with a plain-English catalyst note and a pattern-recognition read — whether the move looks like a clean breakout, momentum continuation, mean-reversion bounce, or extended run with reset risk.
Universe: ~145 curated US common stocks (NYSE + Nasdaq, ≥$300M market cap, ≥$1M average daily dollar volume). Cap tier reflects current market cap, not historical.
Mega-cap leaders (above $200B market cap)
Top gainers — past week
1. ↑ CVX +7.20%
$200.00 · avg $1,610M/day · Mega-cap
Why: Chevron rode a broader energy bid this week as crude firmed on Middle East tensions and integrated majors caught a defensive rotation. The collapse of the PSX/MPC mega-merger chatter also refocused investors on scale players with clean balance sheets. No single-name catalyst — the move looks sector-led with CVX benefiting from its dividend-and-buyback appeal as growth names wobbled.
Pattern: Clean base-and-breakout above the $190 shelf that has capped the stock for weeks, with the close right at the $200 round number. Volume expansion supports the move, but the vertical push into resistance leaves short-term reset potential if crude stalls.
2. ↑ AMD +6.42%
$514.39 · avg $9,735M/day · Mega-cap
Why: AMD caught a fresh AI bid after Stan Druckenmiller’s 13F showed him loading up on the stock while trimming other chipmakers — a high-profile validation that landed midweek. The broader ‘AI sub-sectors are the place to be’ narrative from tech strategists added fuel. No product catalyst; this was positioning-driven flow into a name the market already views as the credible NVDA alternative.
Pattern: Extended momentum continuation off the recent breakout base near $470, pushing through $500 psychological resistance on rising volume. Trend is intact but the stock is now stretched versus its short moving averages — a mean-reversion pullback into the $495-500 zone would be normal.
3. ↑ MRK +5.65%
$135.84 · avg $966M/day · Mega-cap
Why: Merck rallied on defensive rotation into pharma as tech wobbled, with the reported Merck-Gilead partnership speculation giving investors a growth hook to pin the move on. AbbVie’s turf-defense commentary reminded the market that big pharma pipelines are back in focus. No hard catalyst — the move reads as a rotation trade with MRK’s beaten-down valuation catching a bid.
Pattern: Mean-reversion bounce off multi-month lows around $125, reclaiming the $135 level that acted as resistance in July. Move looks like the first leg of a base-building attempt rather than a trend change — needs to hold $132 to keep the reversal thesis alive.
Top decliners — past week
1. ↓ AVGO -8.13%
$392.99 · avg $6,959M/day · Mega-cap
Why: Broadcom got caught in the Druckenmiller 13F headline that showed him dumping select chipmakers while adding AMD — a clear read-through hit sentiment. The broader risk-off tone midweek and rotation out of the most-crowded AI trades amplified the selling. No company-specific news; this was positioning unwind in the most extended semi names.
Pattern: Distribution top pattern — sharp break of the $420 support shelf on heavy volume after weeks of sideways-to-lower price action near highs. Break looks technically decisive. Reset potential toward the $380 gap-fill zone before the next real support kicks in.
2. ↓ HD -4.71%
$338.86 · avg $1,000M/day · Mega-cap
Why: Home Depot slid ahead of its Q2 print next week, with a Barron’s piece flagging that even $68B in shareholder returns hadn’t rescued the stock — a bearish framing that stuck. Weak retail sales data added to fears the housing-linked spend cycle is still soft. No single catalyst — it’s pre-earnings de-risking on a name where the fundamental story hasn’t turned.
Pattern: Trending decline continuing the downtrend from the July $370 high, with the break below $345 confirming lower-highs / lower-lows structure. Not yet oversold on daily timeframes — earnings next week will decide whether this becomes a capitulation flush or a base.
3. ↓ AMZN -4.31%
$262.65 · avg $8,394M/day · Mega-cap
Why: Amazon faded alongside the mega-cap tech complex as the Druckenmiller 13F showed continued rotation and midweek risk-off flows hit the most-owned names. A Thrive Capital $215M investment headline added noise but no fresh catalyst. No company-specific news — this reads as a routine profit-take in a name that had run hard into $280.
Pattern: Mean-reversion pullback within an established uptrend — stock is retesting the $260 breakout shelf from July, which is the first meaningful technical support. Move is orderly rather than distributive; a bounce off $260 would confirm the pullback as healthy consolidation.
Large-cap leaders ($10B to $200B market cap)
Top gainers — past week
1. ↑ DDOG +9.20%
$255.46 · avg $1,378M/day · Large-cap
Why: Datadog surged on the RBC ‘bullish reseller feedback’ note flagging software beats into next earnings, with Cramer piling on midweek. The stock had been beaten down enough that any positive channel-check reading triggered a squeeze. No hard catalyst yet — the move is sell-side sentiment reset ahead of the print, not confirmed fundamentals.
Pattern: Sharp mean-reversion bounce off the $230 area that has acted as support twice this quarter, with volume expansion on the reclaim of $250. Move looks extended into resistance at $260 — needs a base here to avoid a fade back into the range.
2. ↑ ZS +8.85%
$183.60 · avg $442M/day · Large-cap
Why: Zscaler rode the same RBC ‘bullish reseller’ cybersecurity read-through that lifted the broader software complex, plus a Gartner recognition headline that landed at the right time. The AI-driven capex justification narrative is starting to reassert itself. No single catalyst — this is sentiment reset on a beaten-up software name benefiting from a group rotation.
Pattern: Base-and-breakout above the $175 shelf that has capped price action since June, with clean volume follow-through. Structure looks constructive but the move is now up against $185 prior resistance — a pullback to retest $178 would be a healthier setup than chasing here.
3. ↑ IREN +6.86%
$44.06 · avg $2,134M/day · Large-cap
Why: IREN jumped on the Microsoft/Nvidia AI-cloud capacity headline, with the 50MW MSFT deal giving the market a concrete revenue hook rather than the usual speculative AI-pivot storyline. This is the rare case where a Bitcoin-miner-turned-AI-cloud narrative got tangible validation from a hyperscaler.
Pattern: Extended momentum continuation off the $35 base built in July, with the MSFT news powering a clean push through $42. Volume is real. Stock is stretched on short-term measures and the $45-46 zone is prior supply — expect chop or a shallow pullback rather than uninterrupted upside.
Top decliners — past week
1. ↓ CSCO -8.03%
$111.68 · avg $3,861M/day · Large-cap
Why: Cisco extended its post-earnings decline as the market focused on AI hardware margin compression flagged in the release. The Dell comparison headline reinforced the narrative that legacy networking is being squeezed by hyperscaler custom silicon economics. Clear catalyst — the earnings-driven margin story is the driver, not sector rotation.
Pattern: Distribution top confirmed — break of the $118 shelf on heavy volume completes the double-top pattern versus the June high. Trending decline now in force with next real support down at $108. Not yet oversold; further downside likely before any bounce sets up.
2. ↓ ETSY -6.60%
$79.90 · avg $262M/day · Large-cap
Why: Etsy sold off despite constructive AI-shopping commentary, with an Ulta comparison piece and eBay peer weakness dragging the discretionary-online cohort lower. Weak retail sales data hurt the entire pocket. No single catalyst — this is macro-driven weakness in second-tier e-commerce as investors question consumer spend into H2.
Pattern: Trending decline from the $95 July high, breaking below the $82 support that held twice in the past month. Stock is approaching short-term oversold on daily RSI but the structure is broken — bounces are likely to be sold until a base forms.
3. ↓ HON -4.98%
$233.96 · avg $709M/day · Large-cap
Why: Honeywell drifted lower despite management guiding to 15% EPS growth in 2027 — the market wanted more color on the near-term order book. A GE compounding-comparison piece hurt by highlighting HON’s relative underperformance. No hard negative catalyst; this is pre-spinoff positioning as investors wait for the aerospace/automation split to crystalize.
Pattern: Mean-reversion pullback within a broader trading range — stock is retesting the $232 support level that has held since May. Move is orderly rather than a breakdown; needs to hold $230 to keep the multi-month base thesis intact.
Mid-cap leaders ($2B to $10B market cap)
Top gainers — past week
1. ↑ AKAM +13.07%
$124.99 · avg $414M/day · Mid-cap
Why: Akamai popped on a strong Q2 print plus an RBC upgrade calling out an ‘inflecting cloud services opportunity’ — the exact framing bulls have been waiting for on a name that has been a value trap for years. Thursday’s analyst-day flurry cemented the sentiment shift.
Pattern: Explosive base-and-breakout — clean push out of the $105-115 range that has contained the stock since early summer, with volume confirming. Move is stretched short-term but the multi-month base gives room for follow-through toward the $130 prior supply zone.
2. ↑ FUBO +9.61%
$10.15 · avg $19M/day · Mid-cap
Why: FuboTV bounced after Q2/Q3 earnings-call transcripts landed and analysts started digesting the sub trajectory. No blowout news, but the sub-$10 level attracted dip buyers looking for exposure to the Disney/Hulu-Live sports tie-up thesis that hasn’t fully played out. No single clear catalyst — this reads as speculative money returning to a beaten-up name.
Pattern: Mean-reversion bounce off the $9 support that has held multiple times, reclaiming $10 on rising volume. Structure is still a broad range; needs to break $10.50 to signal a real trend change. Extended potential is capped until then.
3. ↑ FCEL +9.50%
$22.37 · avg $174M/day · Mid-cap
Why: FuelCell Energy rallied on hydrogen-rivalry framing plus a carbon-capture headline that gave the story a fresh angle. The Bloom Energy peer commentary rippled positively — when one hydrogen name gets a premium narrative, the others catch a sympathy bid. No hard catalyst — this is thematic momentum in the hydrogen/fuel-cell pocket.
Pattern: Extended momentum move after a multi-week base near $18-19, with the push through $21 on volume looking constructive but stretched. Reset potential real — these names are volatile and give back moves quickly when the sector narrative cools.
Top decliners — past week
1. ↓ BYND -16.50%
$13.47 · avg $40M/day · Mid-cap
Why: Beyond Meat cratered on a brutal Q2 print plus reverse-split headlines that historically signal further downside. The ‘what history says usually happens next’ framing on Barron’s is the kind of piece that accelerates selling in already-weak names. Clear catalyst — earnings-driven capitulation in a stock the market has already given up on.
Pattern: Trending decline extending — no meaningful support until the $12 area, and the reverse-split overhang makes any bounce suspect. Not a setup — this is a broken structure with volume confirming distribution.
2. ↓ LCID -11.65%
$6.22 · avg $40M/day · Mid-cap
Why: Lucid dropped as the Tesla TD Cowen upgrade and $460 target sucked capital out of the EV also-rans. A Cadillac-comparison piece framed Lucid as fighting for scraps in luxury EV, not defining the segment. No single catalyst — this is relative-strength rotation within EV where Tesla is grabbing all the flow.
Pattern: Trending decline — clean break below the $6.60 shelf that had contained the stock for weeks, with volume confirming. No obvious support until $5.80. Structure suggests further downside before any bounce is worth trading.
3. ↓ HIMS -10.89%
$28.15 · avg $479M/day · Mid-cap
Why: Hims & Hers sold off despite raised guidance as the market fixated on the GLP-1 margin reset flagged in the print. The ‘Wall Street cautious on peptides launch’ framing hurt — investors want proof the next growth leg is real, not just guided. Clear catalyst — post-earnings margin fear override guidance raise.
Pattern: Mean-reversion pullback from the $34 recent high into the $28 support zone, with the move looking orderly rather than a breakdown. If $27.50 holds, this sets up as a healthy retest — a break lower opens $25 as the next real support.
Small-cap leaders ($300M to $2B market cap)
Top gainers — past week
1. ↑ ACHR +18.43%
$6.62 · avg $490M/day · Small-cap
Why: Archer surged on the Tesla flying-Roadster demo headlines, which the market read as validating the eVTOL and personal flight category more broadly. Any Musk-adjacent flying-vehicle chatter tends to lift the entire pocket. No direct catalyst for Archer — this is thematic sympathy flow, not fundamental progress.
Pattern: Extended momentum move off the $5 base with a sharp push through $6 on heavy volume. Vertical structure looks stretched — these Musk-adjacent sympathy moves typically give back 40-60% of the gain within days if no follow-through news arrives. High reset potential.
2. ↑ GLSI +16.99%
$16.80 · avg $2M/day · Small-cap
Why: Greenwich LifeSciences rallied without a clear catalyst on the tape — no headlines in the 72h window. Given the microcap profile and $2M daily dollar volume, this looks like retail-driven speculation or anticipation of pipeline updates. No single clear catalyst — most plausible explanation is thin-float speculative flow.
Pattern: Extended momentum move on light volume, which in microcap biotech typically means limited institutional participation. High reset potential — moves like this without news tend to round-trip fast. Structure isn’t a base-and-breakout; it’s a spike.
3. ↑ BTBT +13.77%
$1.57 · avg $33M/day · Small-cap
Why: Bit Digital rallied despite missing Q2 earnings — the revenue beat on cloud growth is what the market latched onto, with the loss attributed to reinvestment. The broader miner-to-AI-cloud pivot narrative is back in favor after the IREN/MSFT deal. Clear catalyst — earnings beat on the revenue line plus thematic tailwind.
Pattern: Mean-reversion bounce off the $1.35 support that has held twice in the past month. Move is on real volume but the stock is still in a broad range — needs to break $1.65 to signal a real trend change. Otherwise, this is a range-bound bounce, not a breakout.
Top decliners — past week
1. ↓ MVIS -34.07%
$2.23 · avg $11M/day · Small-cap
Why: MicroVision collapsed 34% without headline news in the 72h window — this magnitude of move in a microcap typically signals either a delayed reaction to earnings, a customer-contract disappointment, or a capital-raise announcement not yet reflected in the news feed. No single clear catalyst identifiable — most plausible is fundraising overhang or lidar competitive news.
Pattern: Distribution collapse — vertical break of all recent support on heavy volume, with the $2.20 area now the last technical shelf before sub-$2 psychological levels. Not a setup for anything; this is capitulation flow that typically needs multiple days to base.
2. ↓ STUB -9.72%
$8.08 · avg $88M/day · Small-cap
Why: StubHub declined as the Amazon-vs-StubHub comparison piece framed the ticket marketplace as the weaker of the two, and continued post-IPO drift kept selling pressure on. The Kushner-into-Amazon $215M investment headline was a de facto negative signal for STUB by contrast. No single catalyst — this is post-IPO price discovery in an unloved name.
Pattern: Trending decline continuing the post-IPO drift, breaking $8.50 support on rising volume. No natural support until the $7.50 area. Structure is broken; bounces likely to be sold until a real base forms.
3. ↓ KEEL -9.54%
$3.51 · avg $129M/day · Small-cap
Why: Keel Infrastructure faded after the CEO explained passing on the 10 MW Moses Lake expansion — the market read this as management pumping the brakes on the growth story it had been paying a premium for. The ‘67% below fair value’ piece tried to catch the falling knife but couldn’t stem the selling. Clear catalyst — capital-allocation commentary that trimmed the growth narrative.
Pattern: Mean-reversion pullback from the $4 zone into the $3.50 support level, with the move looking orderly rather than a distribution break. If $3.40 holds, this is a healthy retest of prior breakout; a break lower opens $3.00 as the next stop.
What the past week cohort tells us
Leadership this week was decisively AI-infrastructure and hydrogen/fuel-cell adjacent, with the strongest single move coming from small-cap ACHR (+18%) on Musk-adjacent thematic flow and IREN (+7%) on a concrete Microsoft cloud deal. The pattern says risk-on speculation is alive at the small-cap end while the mega-cap AI complex is starting to bifurcate — AMD caught fresh capital via Druckenmiller’s 13F while AVGO got dumped in the same filing, a real rotation signal within the semis. Defensive rotation showed up in CVX and MRK leading mega-cap winners, hinting that some money is quietly moving toward energy and pharma as tech leadership narrows. Return dispersion is wide — MVIS -34% versus ACHR +18% in the same tier tells you microcap speculation is running hot both ways, which historically precedes broader risk-off events by a few weeks. The Cisco and Home Depot breakdowns in mega-cap suggest the market is starting to punish specific fundamental disappointments rather than lifting all boats. Forward observation: watch whether the AMD/AVGO divergence widens next week — if it does, the AI trade is becoming a stock-picker’s market rather than a beta trade, which changes the risk profile for the whole complex.
Bottom line
The top stock movers recap covers every US market-cap tier from mega ($200B+) to small ($300M-$2B). The Past Week view shows sustained leadership and sector rotation — complementary to the daily session recap (single-session moves, Tue-Sat morning Melbourne time).
Get early access to Orbit
Orbit is Luna3.ai’s AI-augmented research engine. 12 algorithmic signals + a gradient-boosted ML model + an agentic LLM that reads each top pick’s filings and writes a daily thesis with conviction score and catalyst proximity. Three regimes, three playbooks — growth in expansion, defensives in late-cycle, recovery plays at panic bottoms. The 3 in Luna3.ai.
No spam. Unsubscribe any time.
No comments yet. Be the first to share your thoughts!