- P/E ratio = price per share ÷ earnings per share. That's the entire formula. Everything else is interpretation.
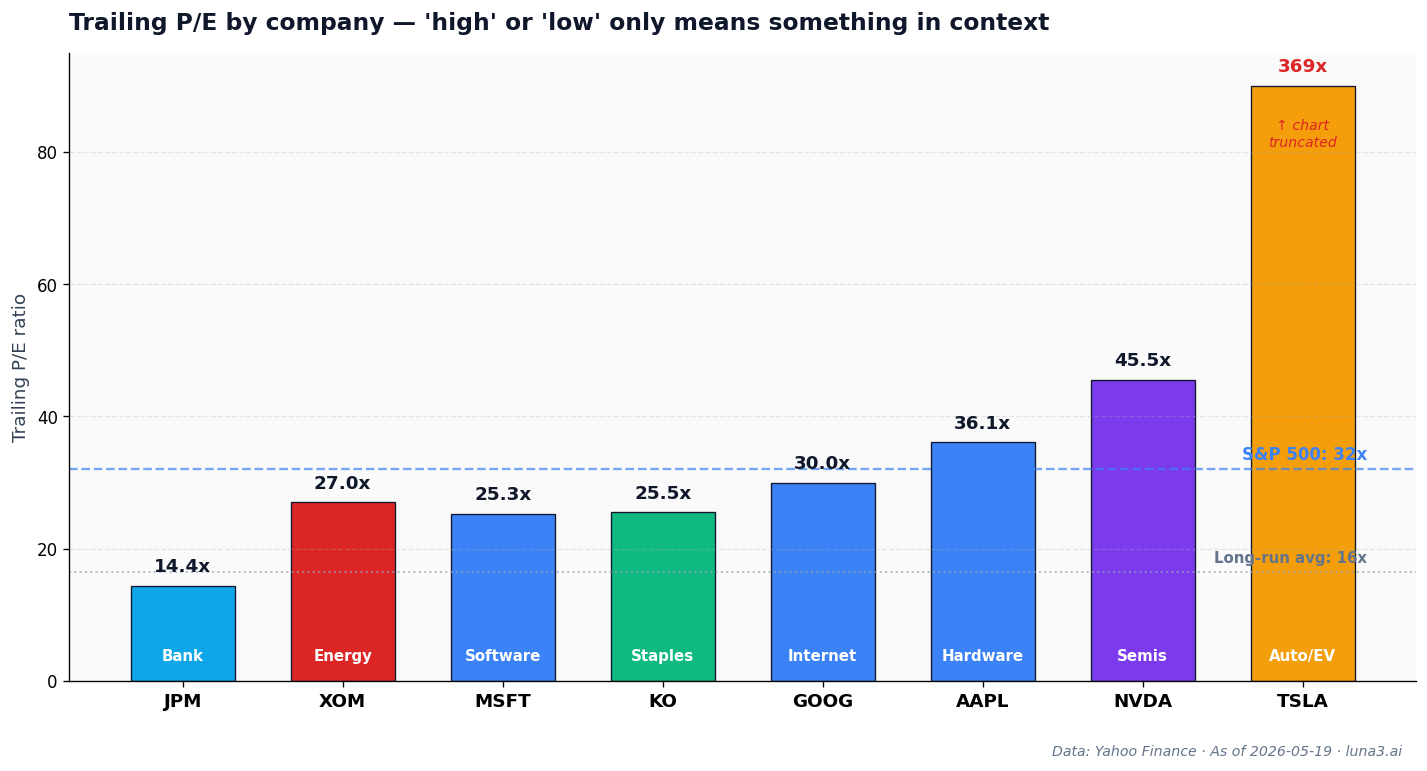
- A 'high' or 'low' P/E only means something against a peer group. JPM at 14× and NVDA at 45× can both be reasonable in 2026 — in different ways.
- P/E lies to you in four specific situations: negative earnings, cyclical peaks or troughs, one-time gains, and accounting differences. Always check what's in the E before quoting the multiple.
If you’ve spent five minutes on Yahoo Finance, you’ve seen the P/E ratio thrown around as if it were a verdict. A stock at 12× is “cheap.” A stock at 60× is “expensive.” Done. Move on. So what is PE ratio, actually, and what does it tell you that the number alone doesn’t? It’s the most over-cited and least-understood metric in retail investing — and the gap between how it’s used and what it actually means is where most valuation mistakes happen.
The short answer: P/E is a relative price tag, not a verdict. It tells you what the market is currently paying for a dollar of this company’s annual earnings. Whether that price is fair depends on three things the number itself can’t tell you — the sector, the earnings cycle, and what’s actually in the denominator.
What is PE ratio, actually?
The literal formula is one line:
P/E ratio = share price ÷ earnings per share (EPS)
“Earnings per share” is net income attributable to shareholders, divided by the number of shares outstanding. If a company earned $10 billion last year and has 2 billion shares, its EPS is $5. If the stock trades at $100, the P/E is 20.
The plain-English translation: you are paying $20 today for every $1 of annual earnings this company currently produces. Equivalently, if earnings stayed flat forever and the company paid all of them out to you, it would take 20 years to get your money back. That mental anchor — “how many years of earnings am I paying for?” — is the most useful way to read any P/E number, including the ones below.
Trailing vs forward P/E: the same word for two different numbers
Here’s where almost every retail explainer stops — and where the most useful nuance begins. There are two P/E ratios for every stock, and they often disagree.
- Trailing P/E (TTM): uses the last four quarters of reported earnings. Backward-looking. Factual. The number you find on Yahoo Finance by default.
- Forward P/E: uses the analyst consensus estimate for the next four quarters of earnings. Forward-looking. Speculative.
When the two numbers are close, the market expects earnings to roughly hold steady. When they diverge dramatically, the gap is the story.
NVIDIA — ticker NVDA — traded at $219.44 going into publication on May 19, 2026. Its trailing P/E is 45.5×. Its forward P/E is 19.5×. That gap — from 45 down to 19 — is the market saying: “we expect this company’s earnings to roughly double in the next twelve months.” Either the market is right (and 45× trailing was a bargain) or wrong (and 19× forward is a fantasy). The trailing number alone doesn’t tell you which. The forward number alone doesn’t tell you what the company has actually delivered.
Honest answer: read both. The trailing number tells you what the business did; the forward number tells you what the market expects it to do; the gap tells you how aggressive that expectation is.
What counts as “high” or “low”? It depends on the sector.
The S&P 500 has averaged a P/E of roughly 16–18× across the last century, per the long-run dataset published by multpl.com’s Shiller-sourced series. As of mid-May 2026, the index is trading at about 32× — nearly twice the long-run average.
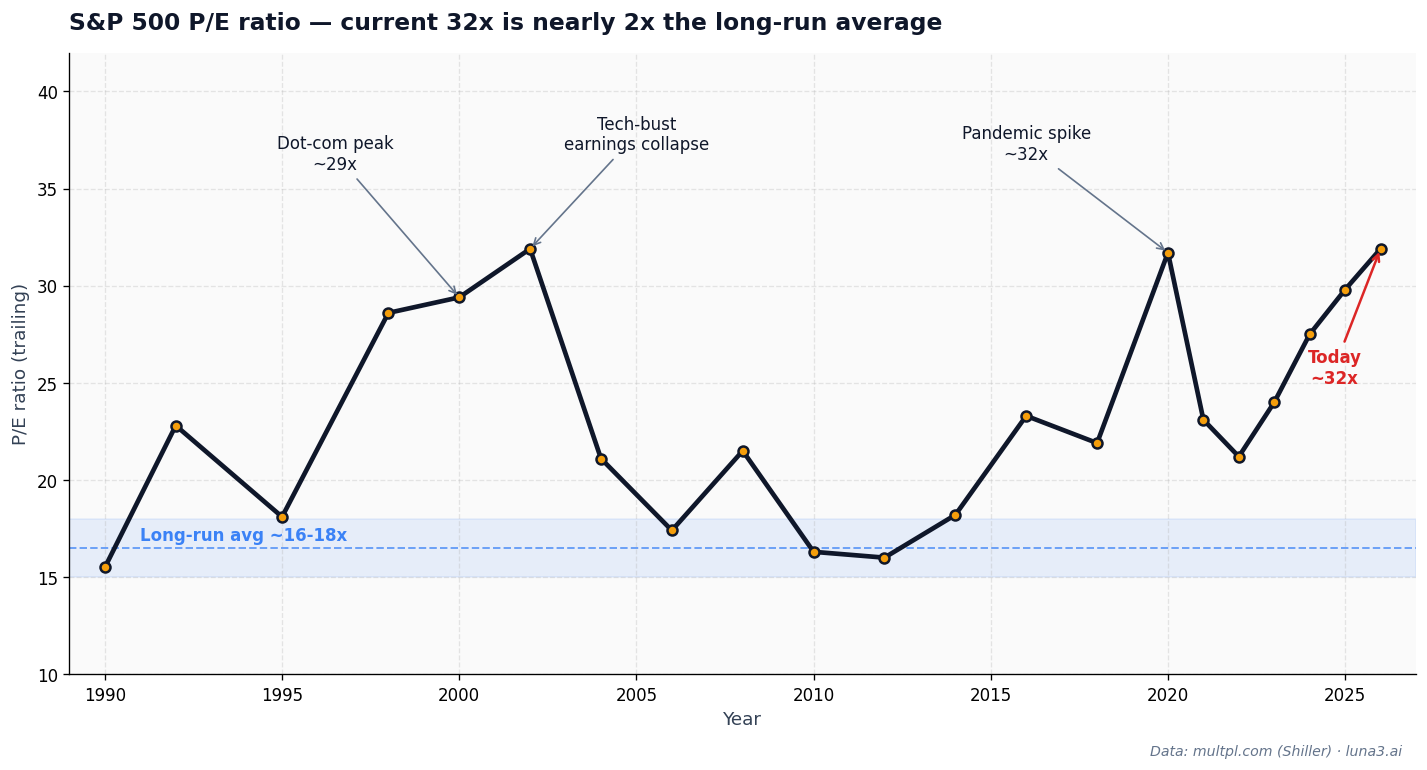
But the “market average” is a misleading anchor for any individual stock. A trailing P/E of 14× on a bank isn’t “cheaper” than 30× on a software company — they belong to different sectors with structurally different earnings profiles. Comparing them on absolute P/E is like comparing rent in Manhattan to rent in Memphis: the number is in the same units, but everything underneath the number is different.
The same comparison applies inside an index ETF that holds every sector — VOO and VTI each blend bank-style 14× multiples with software-style 30× multiples, and the headline index P/E washes those differences out. Here’s what each P/E zone usually signals:
- Banks (JPM at ~14×): structurally low because bank earnings are leveraged, cyclical, and regulated. Investors discount them.
- Energy (XOM at ~27× trailing, ~15× forward): the wide gap is a cyclical signal — trailing earnings reflect a previous price environment; forward expectations have already started to mean-revert.
- Consumer staples (KO at ~25×): middle of the range because earnings are stable but slow-growing.
- Quality tech (AAPL ~36×, GOOG ~30×, MSFT ~25×): premium multiples for durable, high-margin earnings.
- Hyper-growth (NVDA ~45× trailing, ~19× forward): the gap is the entire thesis — investors are paying for future earnings, not present ones.
- Extreme outliers (TSLA at ~369× trailing): the market is pricing a fundamentally different business model. Whether that’s correct is a separate argument; what it means is that the standard P/E lens has lost most of its descriptive power for this stock.
Four times the P/E ratio lies to you
Even within a sector, the headline P/E can be actively misleading. Four common situations:
1. Negative earnings
If a company is losing money, EPS is negative and the P/E becomes mathematically meaningless — you’ll usually see “N/A” or a negative number on a data screen. This is normal for early-stage biotechs, recent IPOs, and turnaround stories. It doesn’t mean the company is uninvestable; it means you need a different lens. Price-to-sales (P/S), enterprise-value-to-EBITDA (EV/EBITDA), or just the path of revenue growth tell you something the P/E can’t.
2. Cyclical peaks and troughs
Energy companies, materials companies, semiconductors at certain points in the cycle — their earnings move with commodity prices or the demand cycle. At the top of the cycle, E is unusually high, so P/E looks unusually low. At the bottom, E has collapsed, so P/E looks unusually high. The naive read — “this energy stock at 8× trailing must be a screaming buy” — gets caught at exactly the wrong moment. XOM at 27× trailing and 15× forward in May 2026 illustrates the live version of this: trailing reflects a previous earnings environment; forward already prices the mean-reversion. The fix: use mid-cycle EPS, or a five-year average P/E, instead of the snapshot.
3. One-time gains (or losses)
A company that sold a division, won a lawsuit, or got a tax benefit has inflated trailing earnings — which depresses the P/E artificially. The opposite happens with a big one-time charge: the P/E spikes for a quarter, then resets. Always check whether reported EPS contains one-time items, and what “adjusted EPS” or “non-GAAP EPS” looks like. The difference between the two is the company telling you which earnings are recurring.
4. Buyback distortion and accounting differences
If a company buys back 10% of its shares but earns the same total net income, EPS goes up by ~11% — which drops the P/E without anything changing in the underlying business. Apple’s P/E has been depressed for years partly because of aggressive buybacks. Different companies also account for stock-based compensation differently, which makes peer P/E comparisons noisier than they look on a screen. The fix: glance at the share count trend before quoting a P/E; if shares are dropping fast, the multiple flatters the picture.
How systematic investors actually use P/E
This is where retail explainers and quant practice diverge most sharply. No serious systematic fund treats “P/E < 15” as a signal in isolation. What they do instead:
- Sector-relative ranking. A quant value strategy doesn’t look at absolute P/E — it ranks every stock within its sector by forward P/E, then goes long the cheapest quartile and (in long/short funds) shorts the most expensive. The signal is “cheap relative to its peers,” not “cheap relative to the market.”
- Z-score vs. own history. A stock trading at two standard deviations above its five-year sector-relative P/E is statistically expensive. That’s the actual factor signal — not the raw number.
- Growth-adjusted (the PEG shortcut). The PEG ratio = P/E ÷ expected annual earnings growth rate. It rolls the multiple and the growth rate into one number. A PEG of 1 is the classic Peter Lynch heuristic: a stock growing 25% per year at a 25× P/E is roughly fair; the same multiple on a stock growing 5% is expensive.
- Combined with quality. Value factors don’t fire in isolation in modern factor models — they’re combined with profitability (ROE, ROIC), balance sheet (debt/equity), and momentum signals. A cheap stock with collapsing margins is a value trap; a cheap stock with stable margins is a value opportunity.
The Luna3 angle: P/E alone is noise. P/E conditioned on (sector, growth rate, cycle position, quality of earnings) is signal. The number itself isn’t the answer — it’s a question that points to four other questions.
A 3-step framework to use P/E without getting fooled
You don’t need a Bloomberg terminal or a factor model to use the P/E ratio more honestly than 90% of retail commentary does. Three questions, in order:
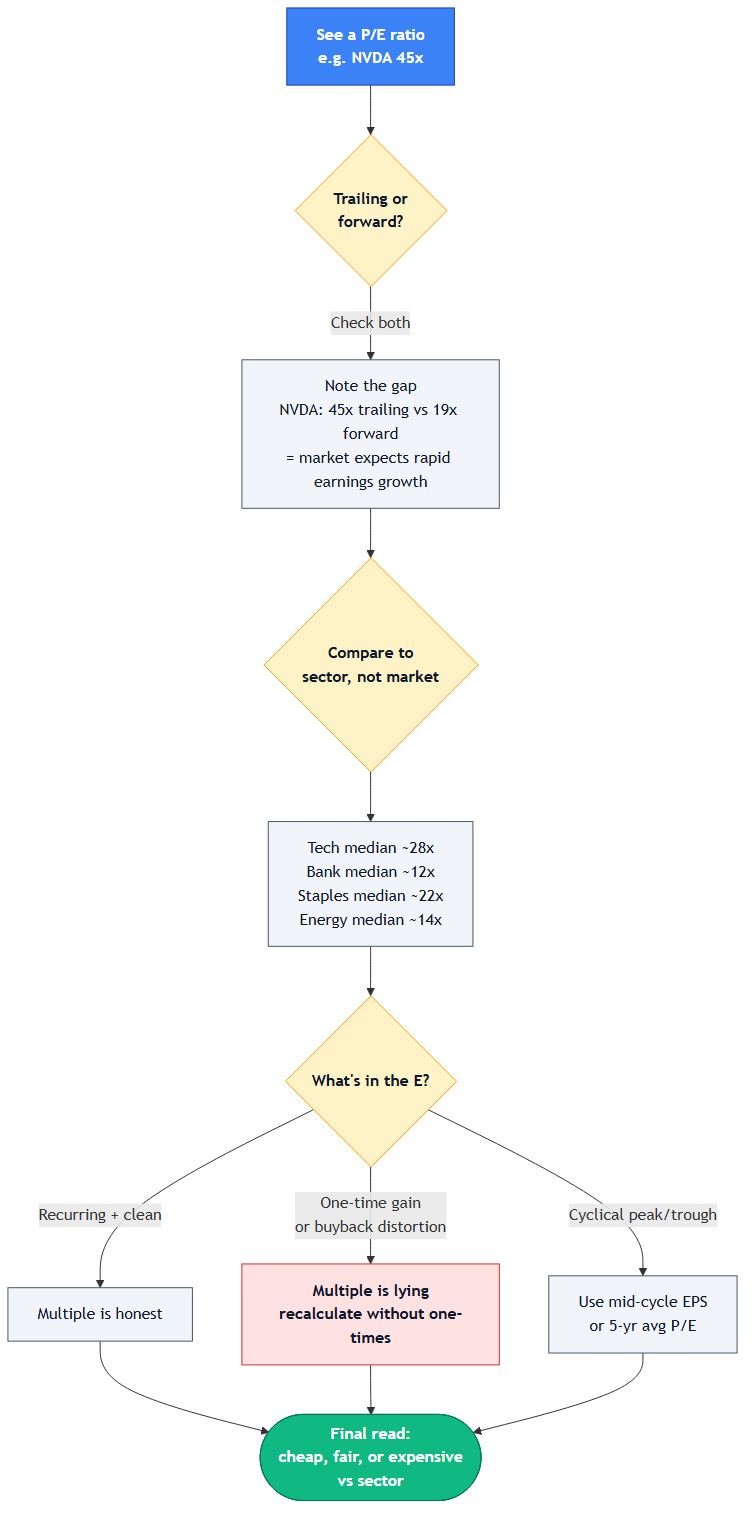
- Look at trailing and forward, side by side. A wide gap means the market expects an earnings change. Decide whether you agree with that expectation before you call the stock cheap or expensive.
- Compare to the sector, not the market. A 14× bank is not “cheaper” than a 36× tech company. They should never be compared on absolute P/E. Find the median P/E for the sector — Damodaran’s NYU sector dataset is the free, primary-source way to do this — and ask whether this stock is cheap relative to that median.
- Ask what’s in the E. Are the earnings real, recurring, and clean? Or do they include a one-time gain, a buyback distortion, or a cyclical peak? If any of those apply, the multiple is lying. Adjust before quoting it.
This is the same workflow we use in our single-name Intelligence analyses — you’ll see the same three checks applied to specific tickers before any thesis call. The framework is portable; the answer depends on the company.
Bottom line
The P/E ratio is a relative price tag, not a verdict. The number alone tells you almost nothing; the number in context — sector, cycle, quality of earnings — tells you a lot. Three questions to ask before you quote any P/E to anyone, including yourself:
- What’s the gap between trailing and forward, and what does it imply about expectations?
- Is this expensive, cheap, or fair compared to its sector?
- Are the earnings in the denominator real, recurring, and clean?
If you can answer all three honestly, you’ve already done more valuation work than the headline “P/E of 22” was ever going to do for you. The investing equivalent of another small number that quietly matters — small differences in how you interpret it compound into very different decisions over time.
Get early access to Orbit
Orbit is Luna3.ai’s AI-augmented research engine. 12 algorithmic signals + a gradient-boosted ML model + an agentic LLM that reads each top pick’s filings and writes a daily thesis with conviction score and catalyst proximity. Three regimes, three playbooks — growth in expansion, defensives in late-cycle, recovery plays at panic bottoms. The 3 in Luna3.ai.
No spam. Unsubscribe any time.
No comments yet. Be the first to share your thoughts!