
- The COT report has been weekly and free since 1962, and most retail traders use it backwards — treating commercials as smart money and positioning extremes as imminent reversal signals.
- Systematic funds use the same data as a regime filter, not a contrarian trade — when managed money Z-score exceeds ±2σ, trend-following exposure gets halved for the next week.
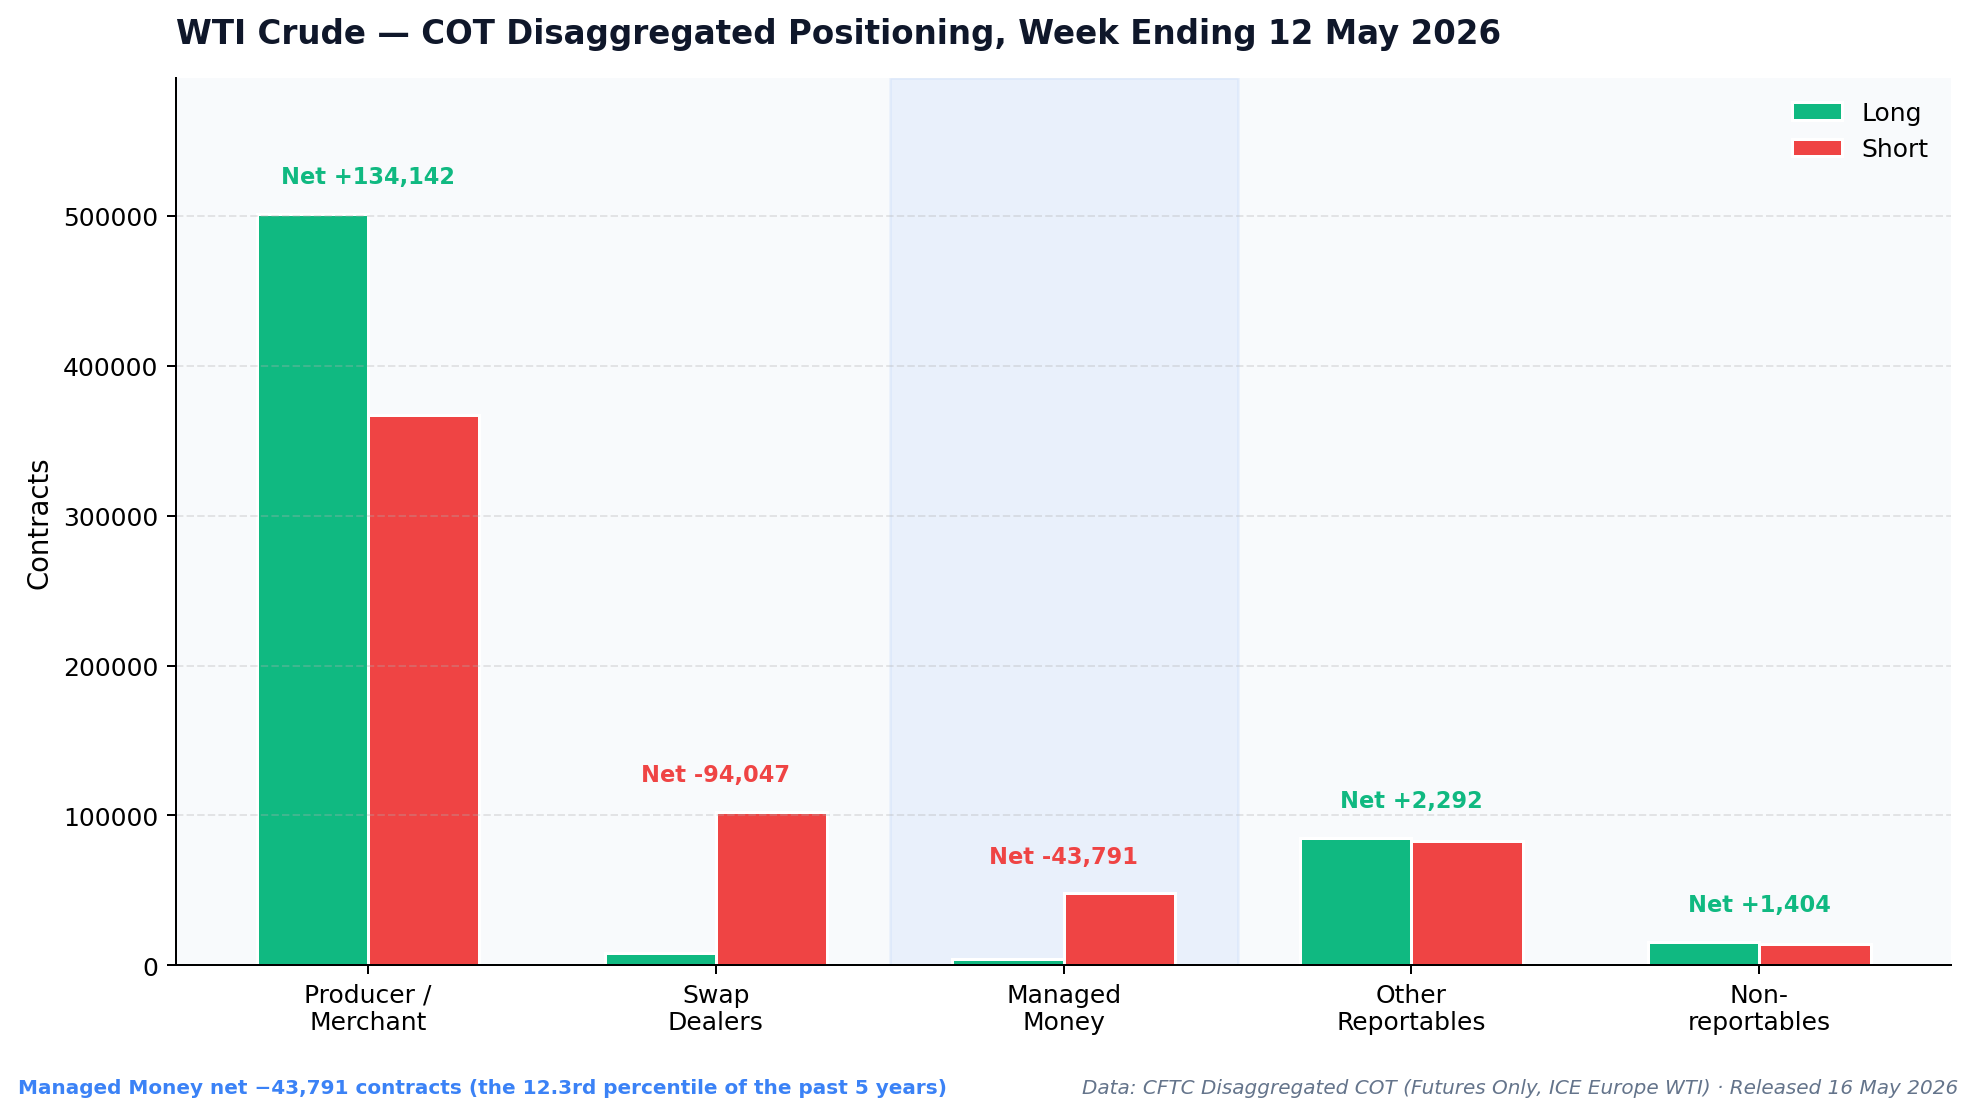
- This week’s WTI managed money net is at the 12.3rd percentile of the past five years; below normal, but well short of the −2σ extreme that fired in July 2025.
The Friday May 16, 2026 COT report showed managed money in WTI crude futures net short −43,791 contracts going into publication — the 12.3rd percentile of the past five years of weekly positioning. On most finance Twitter, that data point feeds the contrarian reflex: speculators are bearish, so crude must be primed to rip. That read is wrong more often than it’s right. By the end of this piece you’ll know why systematic funds use the same number as a regime filter, not a directional trade.
Why the COT report matters
The Commitments of Traders release is the only weekly window the public gets into how the institutional cohorts in US-regulated futures markets are positioned. It has been published since June 13, 1962, which means the data series alongside any major commodity now spans more than six decades.
Despite that length, most retail traders use it backwards. The reflex move — see commercials net short, assume bearish; see managed money net long, assume bullish — gets two facts wrong at the same time. First, “commercials” in the disaggregated COT are physical-market hedgers; their position reflects what their refinery, mill, or mine is doing, not a directional view on price. Second, positioning extremes can persist for months without resolving — the marginal new entrant just isn’t there, but neither is the catalyst that forces the existing book to flip.
The version of the COT data that systematic funds use looks different in two places. They strip out the noise (the “Other Reportables” bucket — corporate treasuries, prop firms — usually doesn’t matter), and they treat the cohort that actually carries the directional view, Managed Money, as a positioning signal, not a contrarian one. The Brunetti, Buyuksahin, and Harris paper “Speculators, Prices and Market Volatility” (Bank of Canada Working Paper 2015-42) documents the empirical case: speculator activity in commodity futures affects price formation in ways the contrarian framing misses entirely.
How the COT report works
Who reports
The CFTC requires every trader holding a position above a contract-specific reporting threshold to report weekly to one of four trader categories. The numbers below come from the most recent Disaggregated Futures-Only release for WTI Crude Light Sweet on ICE Europe — the contract with the cleanest live reporting series — week ending Tuesday May 12, 2026, total open interest 875,230 contracts.
The four reportable categories, with the post-2009 disaggregated breakdown:
- Producer / Merchant / Processor / User — 501,267 long, 367,125 short (57.3% / 41.9% of OI). Physical-market hedgers. Oil refiners, wheat mills, copper smelters, gold producers. They lock in input or output prices via futures, then unwind when the physical trade is done. Their net position reflects commercial activity — refinery utilization, crop cycle, smelter throughput — not a price view. A corn farmer net short corn isn’t bearish corn; he just harvested a crop.
- Swap Dealers — 8,603 long, 102,650 short (1.0% / 11.7%). Banks and dealer-affiliated swap desks. They use the futures market to hedge derivative positions transacted off-exchange. The 2009 disaggregation split this out from “commercials” specifically because conflating swap-hedging flow with physical-market hedging flow distorted the read.
- Managed Money — 4,410 long, 48,201 short (0.5% / 5.5%). Hedge funds, CTAs, systematic trend-followers. This is the directional cohort. Most of the public discussion of “speculators” in the financial press maps onto this single bucket.
- Other Reportables — 85,133 long, 82,841 short (9.7% / 9.5%). Corporate treasuries, prop firms, pension overlays. Almost always noise for positioning analysis.
The residual — non-reportables, 15,715 long and 14,311 short — is the rest of total open interest. Anyone below the reporting threshold. Useful as a rough retail proxy.
What’s reported each week
Release schedule, important and frequently misremembered: Friday at 3:30pm ET, covering positions as of the prior Tuesday’s close. T+3 delay. Federal-holiday weeks shift to the next business day. Two flavors release simultaneously — Futures-Only and Futures-and-Options-Combined. The futures-only version is cleaner for tape-mechanic analysis; the options-combined version is more relevant for any positioning study involving delta exposure. (Confirm timing on the official CFTC release schedule.)
For each category and the residual, the report shows long, short, and net (long minus short) positions in contracts. Managed Money additionally has a “spreading” column — same trader long one contract month, short another, capturing intra-curve arbitrage rather than directional risk.
The most useful normalized variant: net positioning as a percentage of total open interest. Raw contract numbers are not comparable across years because total OI in any given market grows as the market matures. Net % OI is comparable; it’s the variable systematic funds plug into the regime-filter math below.
For WTI right now: managed money net is −43,791 contracts, or −5.0% of OI. Compared to its own 5-year history that net read sits at the 12.3rd percentile — bearish, but well short of the 2025-07-01 extreme of −66,107 contracts, when net dropped to −7.5% of OI.
How to read a single release
Use the waterfall chart above as the template. It reveals three structural facts the headline number hides.
First, the producer/merchant cohort dwarfs everyone else — 868,000+ combined long-and-short contracts versus the 53,000 the managed-money cohort holds total. Whatever Managed Money does this week, it does inside a market the physical-hedging cohort dominates by an order of magnitude. This is why “commercials are short!” headlines mislead — of course they’re short, they’re constantly short, that’s how the hedging book runs.
Second, the net side of Managed Money’s position tells you which way the directional cohort is leaning. The split right now — 4,410 long vs 48,201 short — is the deepest one-sided positioning in this contract since mid-2025.
Third, the Swap Dealer column matters when it diverges. Swap dealers usually run a small net long because their flow is dealer-side hedging of customer short swap exposure. When swap dealer net flips deeply short — as it has, with 102,650 short vs 8,603 long — the read isn’t “swap dealers are bearish.” It’s “the swap book they’re hedging is unusually positioned long.” Swap dealer prints are second-order signals of customer flow, not direct directional bets.
That’s the entire job of reading a single release. The headline contains nothing the waterfall doesn’t.
How an algorithm reads the COT report
This is where the public framing diverges sharpest from how systematic funds actually use the data.
A trend-following fund does not use the COT report as a contrarian signal. They use it as a regime filter — an input that scales their existing trend-following exposure up or down based on whether positioning is at an extreme. The mechanic is short:
# Pseudocode — three-line regime filter
mm_net_pct = (mm_long - mm_short) / open_interest
z = (mm_net_pct - mm_net_pct.rolling(156).mean()) / mm_net_pct.rolling(156).std()

if abs(z) > 2.0:
    regime = "positioning_extreme"
    trend_signal *= 0.5  # halve trend exposure
156 weeks is three years — long enough to span a full commodity cycle, short enough that the rolling mean doesn’t lag the current regime by a decade. Z-score normalizes across markets; the same code runs on crude, gold, ten-year Treasuries, and S&P futures without per-market tuning.
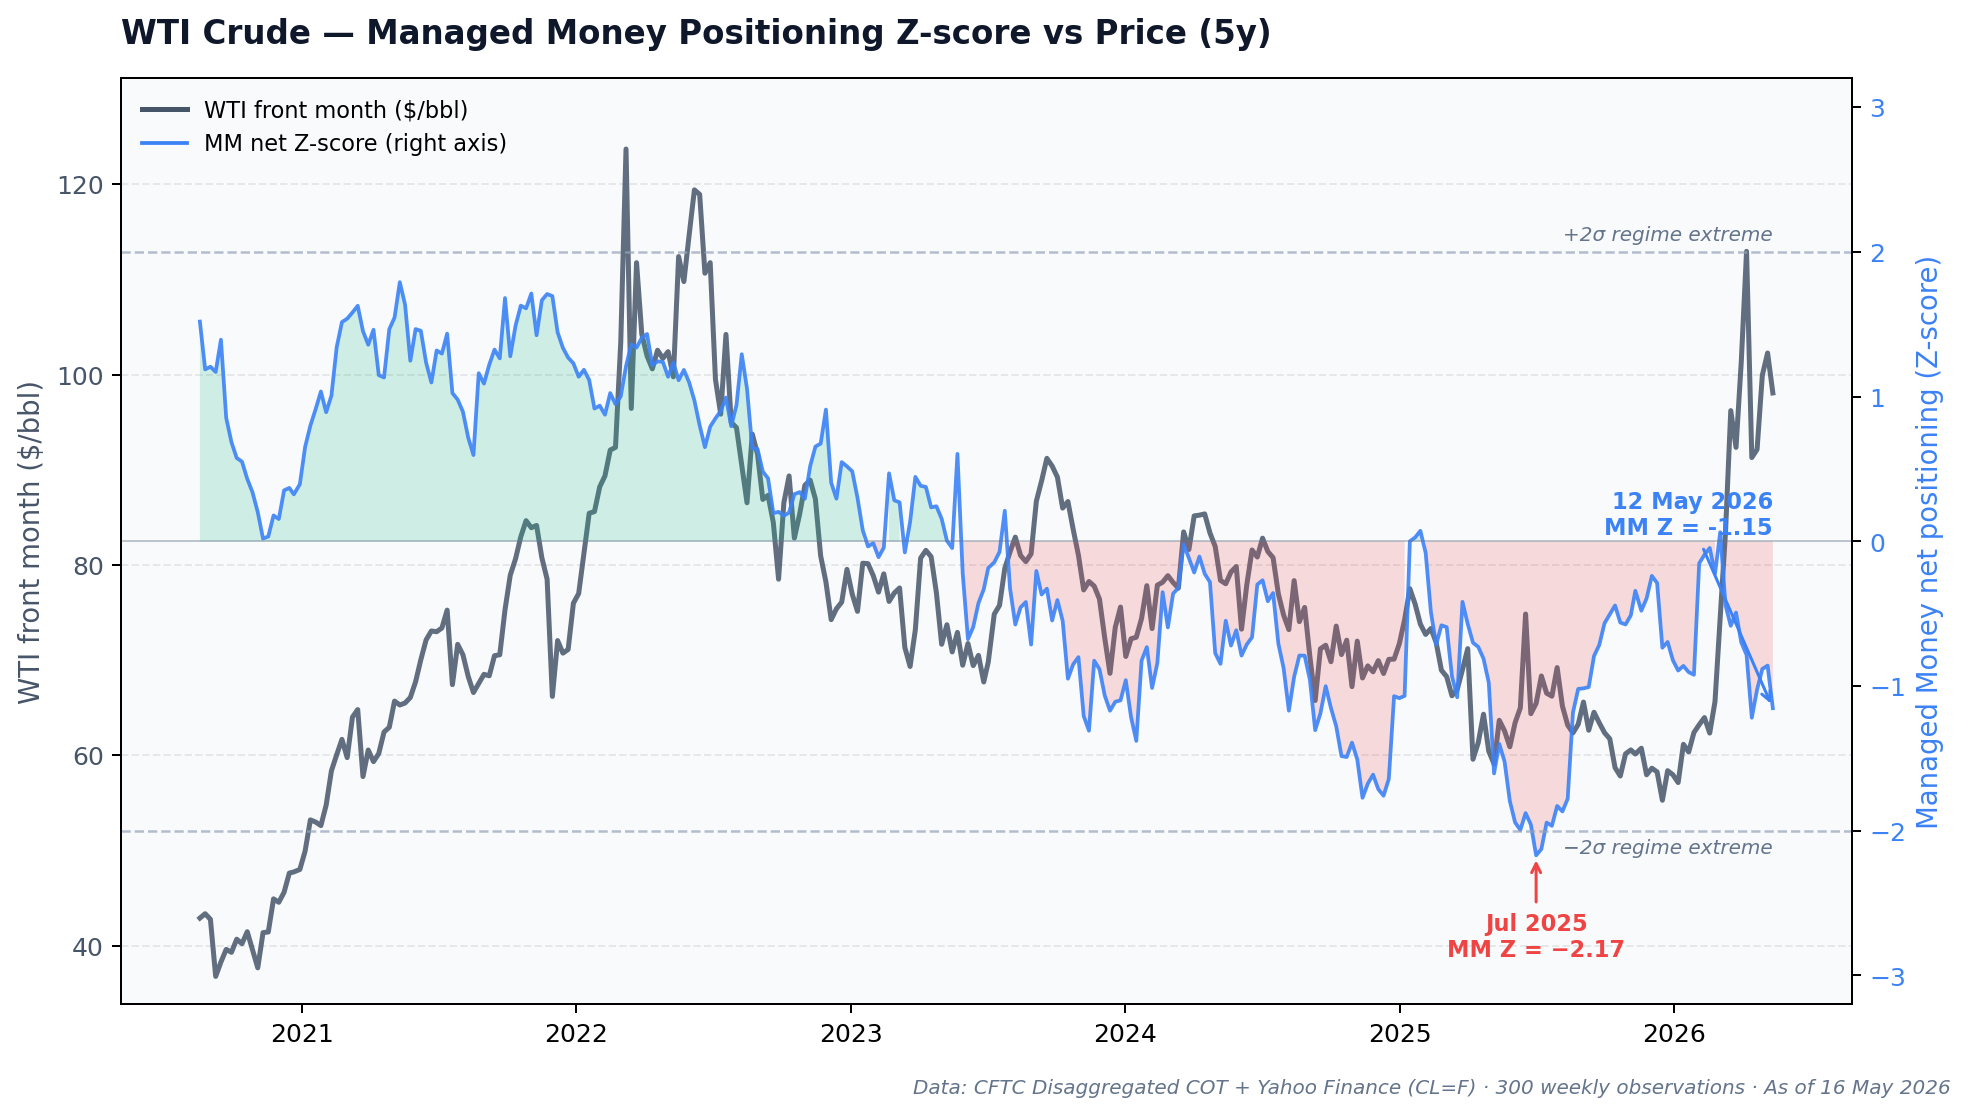
The chart above shows what the filter is actually doing. WTI managed money Z-score trades inside roughly ±2σ most weeks; the dashed lines mark the regime-extreme threshold. The July 2025 extreme — Z = −2.17 — is the kind of moment the filter flags. WTI prices ground another ~3% lower over the following eight weeks and bottomed near $61.87 on September 5, 2025 — a modest drift, not a collapse, but exactly the kind of weeks-long grind that takes the cohort’s existing short book to its limit. The filter wasn’t predicting that drop; it was telling any trend system “do not add to bearish trend exposure here, the existing short book is already at the edge of its range.”
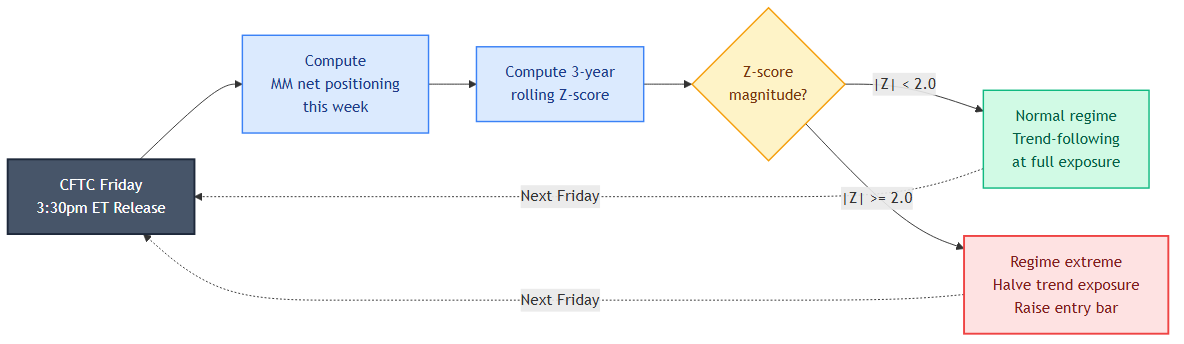
The diagram makes the weekly cycle explicit. CFTC release Friday → compute net positioning → compute Z-score → if magnitude exceeds 2 → halve trend-following exposure for the next week → wait for next release. No discretion. No “but this time it’s different.” The model treats positioning extremes as risk-management signals, not directional ones.
What that does to live performance: trend systems that incorporate a positioning-extreme regime filter take smaller losses in mean-reverting weeks and give up modest upside in trending weeks. The expected-value tradeoff is well-documented in AQR’s “Innovations in Trend Following” and Man Group’s “Trend-Following and Long-Short Quality” series — both worth reading for practitioner intuition.
Signals to watch (and where to get the data)
Four data sources cover everything you’d need:
- CFTC.gov — the official source. Public XLS and CSV downloads weekly. The Disaggregated Futures-Only report uses the four-category split this piece references; the Disaggregated Futures-and-Options-Combined adds options exposure for the same buckets. Pick whichever matches your analysis — futures-only for mechanism studies, combined for total exposure.
- publicreporting.cftc.gov Socrata API — the same data in JSON. Free, no API key. The dataset slug for disaggregated futures-only is
72hh-3qpy. Query examples take five minutes to write. - Tradingster and Barchart COT pages — free visualizations with category overlays on price. Good for visual scanning; less good for systematic work.
- Nasdaq Data Link / Quandl — historical COT time series with clean date alignment. Up to 50 free API calls per day. Best path for backtest-grade historical data.
The four markets where COT is most actionable: NYMEX WTI crude, COMEX gold, 10-year Treasury futures, and S&P 500 e-mini futures. Reason: deepest reporting series, longest history, cleanest separation between hedging and speculative flow, lowest noise from the Other Reportables bucket.
Where retail gets the COT report wrong
Four common misreads:
- “Commercials are smart money.” No. Commercials are physical-market hedgers. Their position reflects how much grain is in the bin, how much refined product is in the pipeline, how much copper is in the smelter. They don’t have a directional opinion to be smart about.
- “Positioning extreme means imminent reversal.” Sometimes. The July 2025 WTI extreme did precede a reversal, but only after another eight weeks of grinding lower. Positioning extremes persist; the signal is “this isn’t a normal regime,” not “fade tomorrow.”
- “Managed Money net long means bullish.” Closer to correct, but still incomplete. Net long can be at +0.5σ (normal) or +2σ (regime extreme). The level matters more than the direction.
- “Trading futures off COT signals on a stock-only account.” COT signals are calibrated to the futures price. Equity ETFs that track those underlyings (USO for crude, GLD for gold, TLT for Treasuries) carry roll cost and tracking error that decouples them from the front-month price the COT signal was built around.
The disaggregated COT report has been live for sixteen years now. The mistake isn’t the data; it’s the inherited contrarian framing that came from the pre-2009 legacy report.
Going deeper
The companion piece to this one — how institutional order flow actually moves price — covers the tape-level mechanic that translates the positioning snapshot above into actual price moves. For live macro context on this week’s setup, see the latest Market Pulse Digest week-ahead. The full historical Z-score series for the four major contracts — plus the regime-filter source code referenced above — is on the Orbit research engine waitlist below.
Get early access to Orbit
Orbit is Luna3.ai’s AI-augmented research engine. 12 algorithmic signals + a gradient-boosted ML model + an agentic LLM that reads each top pick’s filings and writes a daily thesis with conviction score and catalyst proximity. Three regimes, three playbooks — growth in expansion, defensives in late-cycle, recovery plays at panic bottoms. The 3 in Luna3.ai.
No spam. Unsubscribe any time.
No comments yet. Be the first to share your thoughts!