- A bond is a loan: you lend money to a government or company, they pay you fixed interest payments, and return your principal at maturity.
- Bond prices and yields move in opposite directions. When interest rates rise, the price of existing bonds falls. This is the one mechanism most stock investors miss.
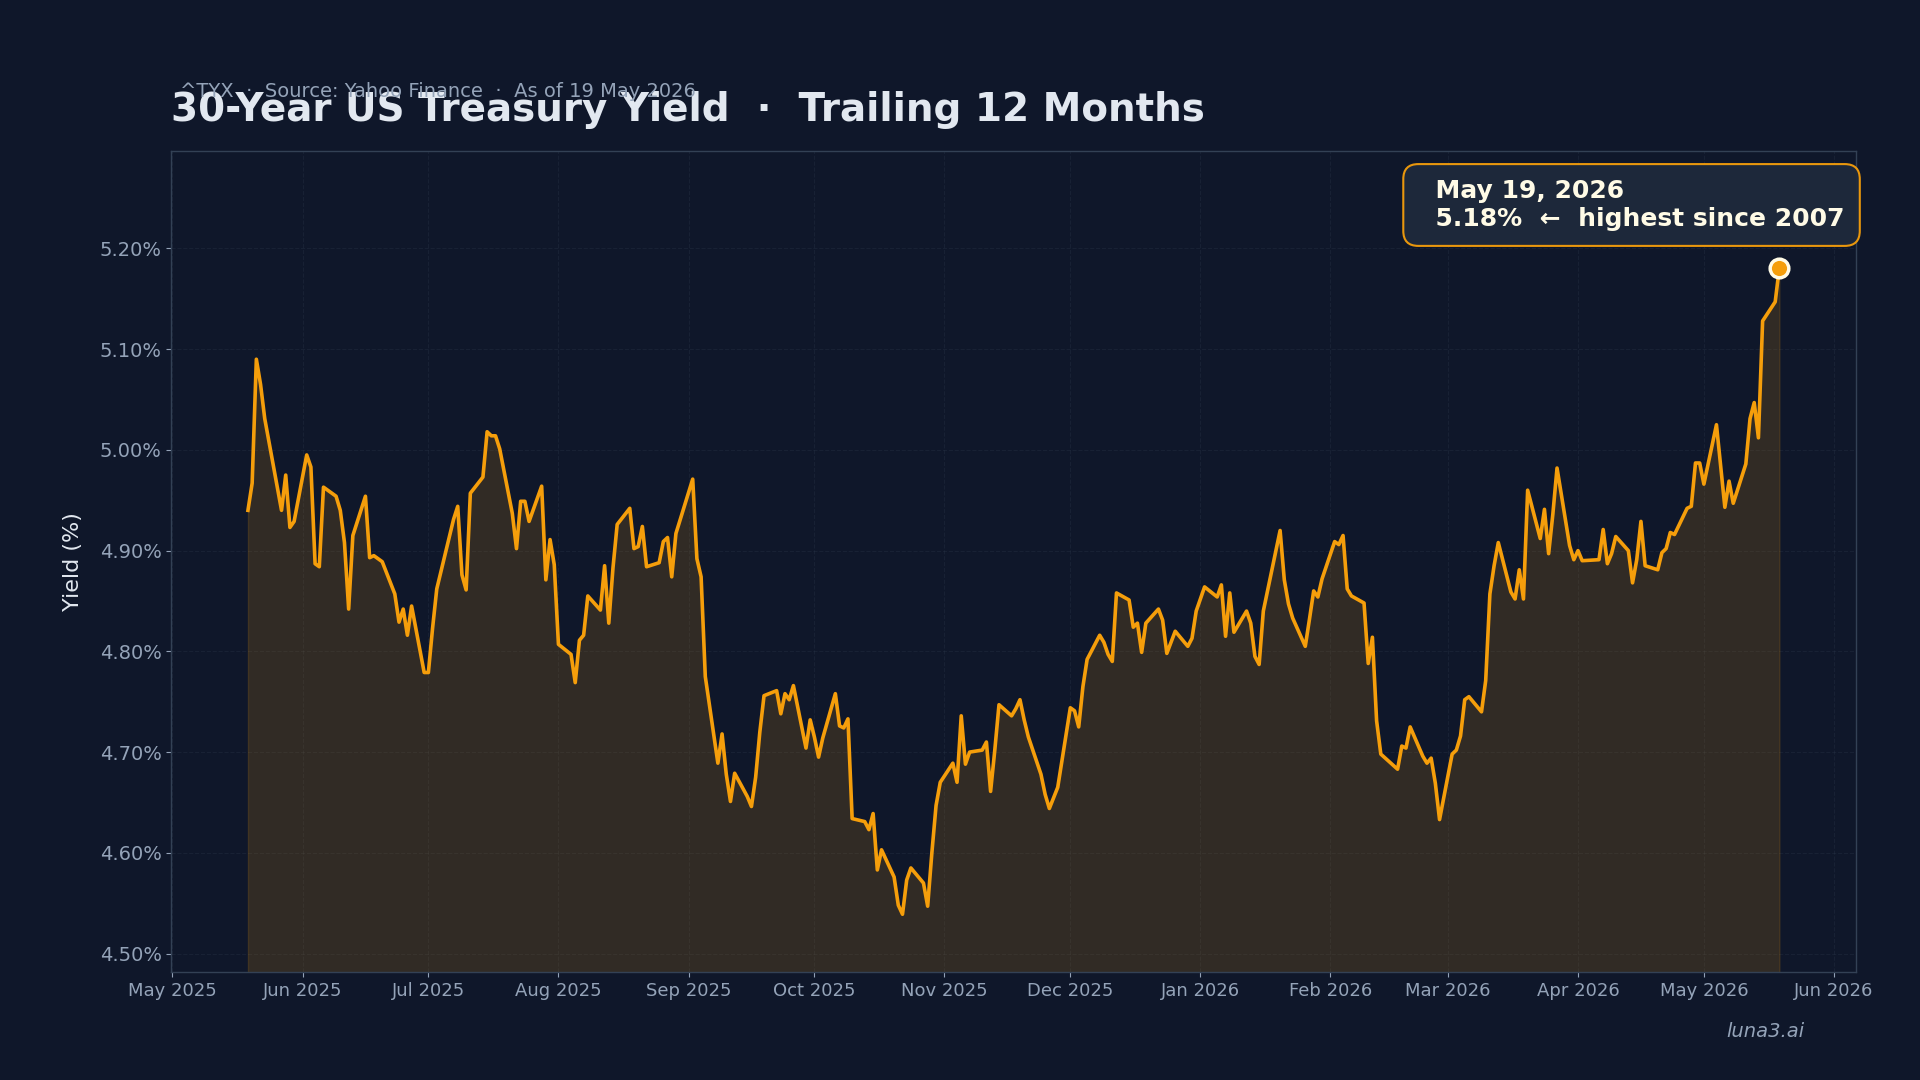
- With 30-year US Treasury yields at 5.18% — the highest level since 2007 — bonds matter for your stock portfolio whether you own them or not. They set the discount rate for every equity.
Most stock investors never think about bonds until rates spike and their portfolio drops without warning. That is happening right now. On 19 May 2026 the 30-year US Treasury yield closed at 5.18%, with an intraday print of 5.197% — the highest level since 2007. Growth stocks took the hit and most retail investors had no idea what was driving it. So: what is a bond, really? In this post we walk through the loan analogy, the four parts of every bond, the one math example that explains why prices fall when yields rise, and why the bond market is doing more to set the cost of capital for your equities right now than at any point in the past 19 years. You do not need to buy bonds. But you need to understand them.
What is a bond? The loan analogy that explains everything
A bond is a loan. That is the whole concept. When you buy a bond, you are the lender. The issuer — a government, a city, or a company — is the borrower. They agree to pay you interest on a fixed schedule and return your principal on a specific date called the maturity. That is the entire deal, written into a legal contract before a single dollar changes hands.
This is the cleanest way to see how a bond differs from a stock. When you own a stock, you own a slice of the business: you share in the upside if things go well and the pain if they do not. Dividends, when they exist, are paid out of leftover profits, and they can be raised, cut, or scrapped — we covered exactly how that works in our explainer on how stocks pay dividends from leftover profit. A bond is different. A bond is a contract. The interest payment is locked in before you ever buy it.
That contractual nature is why bonds are called “fixed income.” The cash flows are fixed the moment the bond is issued. Buy a $1,000 US Treasury at a 4% coupon and you receive $40 every year for the life of the bond plus $1,000 back at maturity. The Treasury cannot decide to pay $35 next year because budget is tight. If they did, it would be a default.
For a corporate bond the contract is the same, just with a riskier counterparty. A company can default, but the legal hierarchy in bankruptcy puts bondholders ahead of shareholders. If the business goes under, lenders get paid from whatever is left before equity holders see a cent. The trade-off: less upside than stocks, but a senior claim on cash flows and a higher seat in the capital structure when things go wrong.
The four parts of a bond: face value, coupon, maturity, yield
Every bond can be described with four numbers. Get these straight and the rest of the bond market stops being intimidating.
Face value (also called par). The amount the issuer agrees to pay you back at maturity. For most US Treasuries and corporate bonds, par is $1,000 per bond. When you read a price quote like “the bond is trading at 98,” that means $980 buys a $1,000 face-value bond — its market price is 98% of par.
Coupon rate. The annual interest rate, expressed as a percentage of face value. A 4% coupon on a $1,000 bond pays $40 a year, usually split into two payments of $20 every six months. The coupon is set at issuance and does not change. A “zero coupon” bond pays no interest along the way; instead you buy it at a steep discount and collect par at maturity, with the gap as your return.
Maturity. The date the issuer repays your principal. The US Treasury issues debt across a wide ladder: T-Bills run from a few weeks to one year, T-Notes from two to ten years, T-Bonds from twenty to thirty years. Shorter maturity means less time for things to go wrong. Longer maturity means more income and far more price sensitivity to interest-rate moves.
Yield. The actual return you will earn based on the price you paid, which is not always the coupon. If you buy a $1,000 bond with a 4% coupon at par, your yield is 4%. But if you buy that same bond on the secondary market for $900, your $40 coupon now represents a 4.44% return on your $900 investment. Yield is what the market quotes, because yield is what actually matters to a buyer at any given price.
Two more terms round it out. The credit rating is a letter grade from Moody’s, S&P, or Fitch that signals the issuer’s likelihood of paying you back. Ratings run from AAA down through investment grade (to BBB-) and into high yield or “junk” (BB+ and below). Higher risk means a higher coupon to attract buyers. Duration is a measure of how sensitive a bond’s price is to rate moves. Longer maturity and lower coupon both push duration up — and we will come back to it in the math example below.
Why bond prices fall when interest rates rise (the mechanism most stock investors miss)
This is the part that trips up almost every new bond investor, so we will go slowly with real numbers.
Imagine you bought a $1,000 Treasury bond last year. It pays a 4% coupon. That means $40 a year, contractually, until maturity. Nothing about that payment can change.
Now the Treasury starts issuing brand-new bonds at 5%. Same $1,000 face value. Same credit quality. Same maturity. The new ones pay $50 a year instead of $40.
Here is the question that decides everything. If you tried to sell your old 4% bond at $1,000, who would buy it? Nobody. Why would anyone pay $1,000 for a bond paying $40 a year when they can pay the same $1,000 for a new bond paying $50? The old bond does not get bought at face value. It gets bought at a discount.
How much of a discount? Just enough to make the math match. The bond falls in price until its $40 annual coupon represents the same 5% yield the new bonds offer. The arithmetic: $40 divided by 5% is $800. That is where your bond settles in the secondary market. You have not sold it. The cash flow has not changed. But if you tried to liquidate today, $800 is what you would get.
That is the whole mechanism in one example. The cash flow is locked. Only the price can move to make the yield match the market. Bond prices and bond yields are two sides of the same equation. When one rises, the other has to fall.
The reverse case works the same way. Suppose rates fall to 3% instead, with new bonds paying just $30 a year. Your old 4% bond looks generous, and buyers bid for it until the $40 coupon represents 3% of the new market price — about $1,333. Your bond trades at a premium because its cash flow is richer than what the market is currently offering.
Now layer on duration. Longer-maturity bonds have more years of fixed payments locked in, so the price has to move further to recalibrate the yield. A 30-year bond swings far more violently for the same 1% rate move than a 2-year note. This is not theoretical. It is the entire reason TLT, the iShares 20+ Year Treasury Bond ETF, fell from a peak of $143.79 on 4 August 2020 to a trough of $74.27 on 19 October 2023 — a 48% drawdown from a US Treasury fund. The Treasury did not default. It was a duration story: rates rose, long-dated bond prices had to fall to recalibrate, and TLT amplifies exactly that exposure. With the 30-year now yielding 5.18% versus the 0.94% close-low touched on 9 March 2020, anyone who bought near peak prices in 2020 is sitting on losses that look more like a tech-stock bear market than a “boring fixed-income allocation.”
Types of bonds every stock investor encounters
The bond universe is huge, but most retail investors only need to know four flavours: Treasuries, corporates, municipals, and bond ETFs that bundle the first three.
US Treasuries are the bedrock. They are debt issued by the US federal government, and they set the “risk-free rate” benchmark every other bond and equity gets priced against. As of 19 May 2026, the three key Treasury yields are: the 13-week T-Bill (^IRX) at 3.58%, the 10-year (^TNX) at 4.67%, and the 30-year (^TYX) at 5.18%. The yield curve is now positively sloped and steep. Investor.gov has a good primer on Treasury and other fixed-income products, and the live yield curve source of truth is the US Treasury yield curve data center.
One nuance worth flagging: the US lost its last AAA credit rating on 16 May 2025, when Moody’s downgraded the country from Aaa to Aa1. S&P has held the US at AA+ since 2011 and Fitch followed in 2023. All three are still investment-grade and the practical impact on Treasury demand has been minimal, but it is part of why long-duration yields keep grinding higher. The structural backdrop is fiscal deficits and rising debt-service costs, not an imminent default.
Corporate bonds are debt issued by companies, split into two tiers. Investment-grade (IG) corporates are rated BBB- and above and pay a small yield premium over Treasuries to compensate for credit risk. High-yield bonds, also called “junk” or HY, are rated BB+ and below and pay a much larger premium because default rates are meaningfully higher. The BBB-minus to BB-plus line is one of the most-watched ratings boundaries in the world, because many institutional bond funds are legally required to sell anything downgraded into junk.
Municipal bonds (munis) are issued by state and local governments to fund roads, schools, and hospitals. The headline feature: muni coupons are usually exempt from federal income tax, and sometimes state tax too if you live in the issuing state. That tax shield makes munis especially attractive to higher-income earners in high-tax states.
Bond ETFs are how almost every retail investor actually owns bonds today. Instead of buying individual issues, you buy a single ticker holding hundreds or thousands of bonds. AGG (iShares Core US Aggregate Bond ETF) and BND (Vanguard Total Bond Market) cover the entire investment-grade US bond market in one click. TLT holds 20+ year Treasuries and gives concentrated long-duration exposure — useful for hedging deflationary scenarios, brutal in a rising-rate regime. SHY holds 1-3 year Treasuries with much lower duration risk. SGOV holds T-Bills and currently delivers a 30-day SEC yield near 3.5%, the kind of short-end coupon that lets cash actually earn something for the first time in around fifteen years. If you have already read our explainer on how bond ETFs like AGG and TLT package these into single-ticker exposure, the wrapper mechanics here will already be familiar.
How bonds fit into a stock portfolio: the 60/40 question
For decades, the standard retail allocation framework was 60/40: 60% stocks, 40% bonds. The pitch made intuitive sense. When economic growth slowed, central banks cut rates. Lower rates pushed bond prices higher at the same moment equities were getting hit on weakening earnings. Bonds zigged while stocks zagged. That negative correlation produced smoother returns than either asset class alone.
Then 2022 happened. Inflation surged to its highest level in forty years and the Fed launched the steepest rate-hiking cycle since the early 1980s. Both stocks and bonds fell at the same time: the S&P 500 dropped about 18%, the Bloomberg US Aggregate Bond Index fell 13%, and a 60/40 portfolio had its worst year since 1937. The diversification benefit broke down because rising rates were punishing both legs of the portfolio. 2025 and 2026 are rhyming.
The honest answer is that 60/40 works some of the time, and regime matters. In disinflation, bonds zag and the framework holds. In inflation, both can fall together. The hidden parameter is duration. A 60/40 portfolio that holds AGG has a weighted-average duration of around 6 years. A portfolio that swaps part of that into TLT might be running 15+ years of duration without realising it — same “40% bonds” label, completely different sensitivity to rates.
The practical takeaway for stock investors today is twofold. Short-duration bonds in the 3.5–3.8% range are genuinely competitive: SGOV at the front of the curve, SHY for 1-3 year exposure, individual T-Bills if you want the simplest instrument. They are paying real money for the first time in a decade and a half. Long-duration bonds, however, are not “the safe part of the portfolio” right now. TLT carries equity-like volatility because its underlying holdings carry equity-like duration risk. Reaching for yield by going long the curve without understanding duration is how investors get blindsided.
What 5.18% yields mean for your stocks in May 2026
Even if you never buy a single bond, the bond market is moving your stock portfolio every day. Three concrete reasons why the May 2026 yield environment matters for equity investors:
Risk-free competition. When 13-week T-Bills pay 3.58% and 30-year Treasuries pay 5.18%, the equity risk premium has to widen for stocks to remain attractive. Every dollar that flows into a 5% Treasury is a dollar that did not flow into the S&P. Institutional allocators rebalance toward bonds when yields rise above certain thresholds, and 5% on the long bond is well above the triggers that show up in pension-fund and insurance-company allocation models. The capital flow follows the math, and the math currently favours bonds in a way it has not for almost two decades.
The discount rate. Every equity valuation model (discounted cash flow, dividend discount, residual income) uses a long-term interest rate as the discount factor for future earnings. Higher yields mean a higher discount rate, which means future cash flows are worth less in present-value terms. The further out those cash flows, the more they get penalised. This is exactly why long-duration growth stocks like AI infrastructure, unprofitable software, and biotech get hit hardest when long yields spike. We dug into this dynamic in our piece on why growth stocks get hit harder when rates rise than dividend payers.
The cost of capital. Every public company you own is paying more for new debt. Mortgages are priced off the 10-year Treasury. Corporate borrowing costs reset against the Treasury curve plus a credit spread. When the 30-year sits at 5.18%, refinancing existing debt at maturity is meaningfully more expensive than the rates that debt was issued at five or ten years ago. That hits free cash flow before it shows up in stock prices, especially for leveraged businesses and capital-intensive industries.
The 2025 Moody’s downgrade is the structural footnote behind all of this. The US still pays its debts and Treasury demand remains real, but the era of unanimous AAA credit on US sovereign paper is over. Yields at 5%+ may not be a temporary spike. They may be the new baseline.
The bottom line
A bond is a loan with fixed cash flows: a coupon on a schedule and a return of principal at maturity, written into a legal contract. Because the cash flow is locked, only the price can move to make the yield match the prevailing market rate. When rates rise, existing bond prices fall. When rates fall, existing bond prices rise. The math is simple and the mechanism is universal — it applies whether you hold a single $1,000 Treasury or a slice of TLT.
Right now, with the 30-year US Treasury yield at 5.18% — its highest since 2007 — the bond market is doing more to set the cost of capital for every company you own than at any point in the past 19 years. It is the discount rate baked into every valuation model, the alternative every dollar of equity capital is being measured against, and the borrowing benchmark behind every mortgage, credit card, and corporate refi. You do not have to own bonds to be affected by them. You just have to own anything that gets priced against them, which is almost everything. The first step toward making sense of this market is understanding what a bond actually is. Now you do.
Get early access to Orbit
Orbit is Luna3.ai’s AI-augmented research engine. 12 algorithmic signals + a gradient-boosted ML model + an agentic LLM that reads each top pick’s filings and writes a daily thesis with conviction score and catalyst proximity. Three regimes, three playbooks — growth in expansion, defensives in late-cycle, recovery plays at panic bottoms. The 3 in Luna3.ai.
No spam. Unsubscribe any time.
No comments yet. Be the first to share your thoughts!