- The US economy is still in expansion in May 2026 — yield curve steepening (10Y-3M at +0.92pp), high-yield credit spreads tight at 2.76%, and the SPY trend bullish.
- Two watch signals (VIX 5-day avg at 17.8 vs long-run mean ~19.5; Sahm Rule at +0.13pp vs the +0.50pp recession trigger) are creating noise, not signaling a regime change.
- The composite read favors growth-oriented positioning. Defensive allocation makes sense as a hedge, not a pivot.
The Sahm Rule is flickering. The VIX has been creeping higher. Headlines keep using the word “recession.” Step back and run a proper economy check — yield curve, equity trend, high-yield credit, plus the volatility and labor-market indicators getting all the attention — and a clearer picture emerges. Four of five core signals are still pointing to expansion. The two that look softer remain well below their actual trigger thresholds.
This economy check walks through all five.
The thesis
Five signals form the backbone of any honest US economy check: the yield curve, equity trend (SPY), high-yield credit spreads, the VIX, and the Sahm Rule. As of mid-May 2026, four sit in expansion-supportive territory. The two elevated readings — a VIX above its calm-market range and a Sahm Rule reading above zero — are well short of the levels that historically precede a recession. The composite read: growth, with eyes open.
Why now — the setup
Markets are doing a strange dance. The S&P 500 is at or near highs. The VIX is at 17.8 — not panicked, but no longer the sub-15 calm of late-cycle complacency. The Sahm Rule, the unemployment-based recession indicator that has triggered ahead of every US recession since 1970, is sitting at +0.13pp. That’s not nothing. It’s also not the +0.50pp level that the rule defines as a trigger.
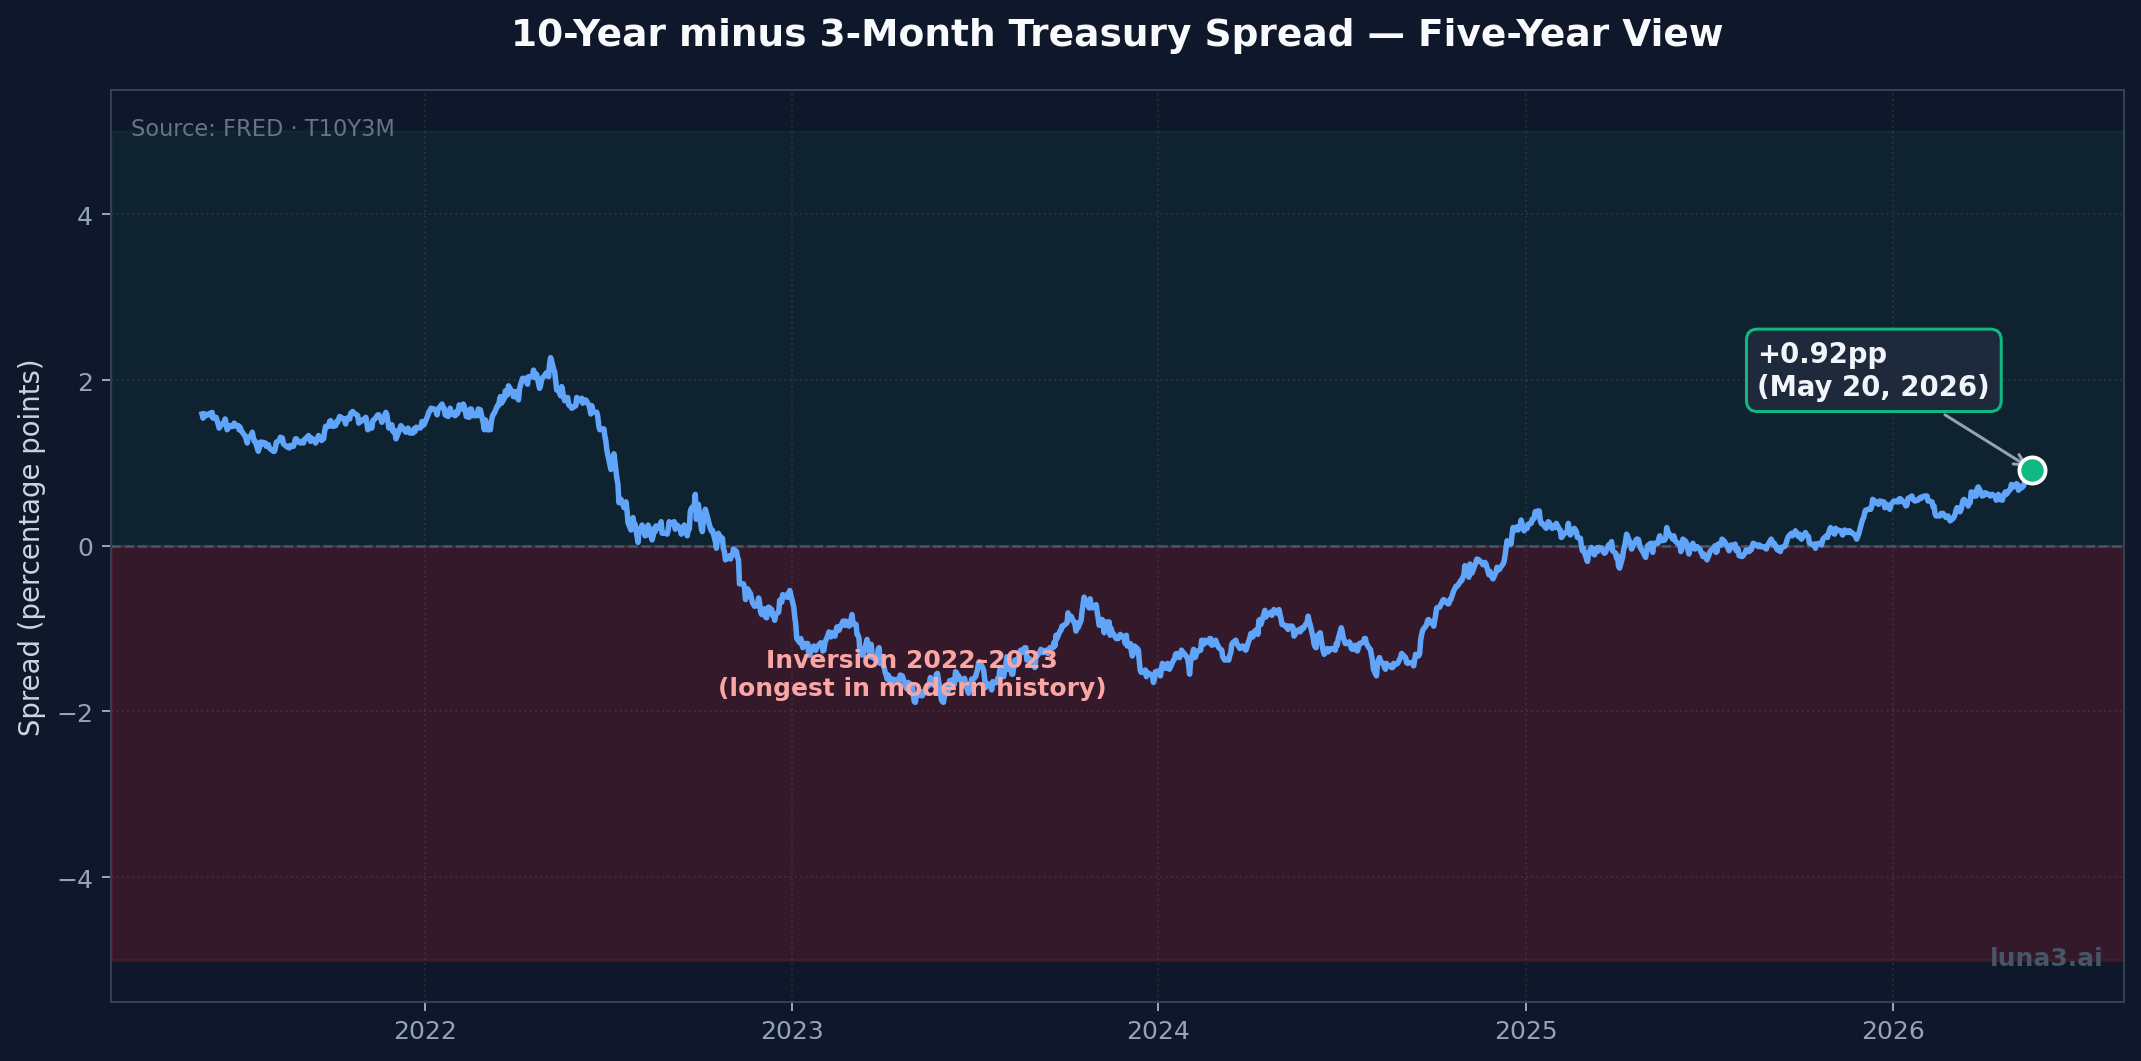
Meanwhile, the yield curve has uninverted and is steepening — a structural recovery signal markets spent 16 months waiting for through the deepest inversion in modern history. Credit spreads on high-yield bonds are tight, near 2.76%, well below the 500 basis point threshold investors typically flag as stress.
The instinct is to focus on the scary signals. The discipline is to weight them against the ones that have historically led every actual recession. A useful economy check does both.
What the yield curve is showing
The yield curve — the difference between long-term and short-term Treasury rates — is the single most reliable recession indicator in modern macroeconomics. When it inverts (short rates above long rates), a recession typically follows within 12–24 months. When it un-inverts and steepens, the all-clear is starting to sound. If you want the fundamentals first, our explainer on bonds and the yield curve covers the mechanics.
As of May 20, 2026, the FRED data shows:
- 10-year minus 3-month Treasury spread: +0.92pp (FRED T10Y3M)
- 10-year minus 2-year Treasury spread: +0.53pp (FRED T10Y2Y)
Both positive. Both steepening. For context: the curve was inverted from July 2022 through November 2023 — the longest inversion in modern history. The widely-predicted recession that should have followed didn’t materialize the way the consensus expected. GDP grew 2.9% in 2023 and 3%+ annualized in much of 2024, per TD Economics.
What matters now: the curve is positively sloped and steepening. Lenders are demanding more compensation for tying up money for 10 years than for 3 months — they expect higher growth and higher rates ahead. That’s the textbook expansion signal.
What the VIX is saying (and what it isn’t)
The VIX measures the market’s expectation of S&P 500 volatility over the next 30 days. Its long-run mean sits around 19.5, with a median closer to 17.5 (per Macroption).
At a 5-day average of 17.8, the VIX is moderately elevated — above the sub-15 levels of complacent late-cycle markets, but well below the levels that historically precede growth slowdowns. Sustained readings above 25 for several weeks have preceded equity drawdowns; sustained readings above 30 have preceded actual growth shocks. We’re not close to either.
The cleanest read of the current VIX level: investors are pricing in more risk than they were six months ago, but not crisis risk. That’s repricing, not unwinding.
What the Sahm Rule is showing
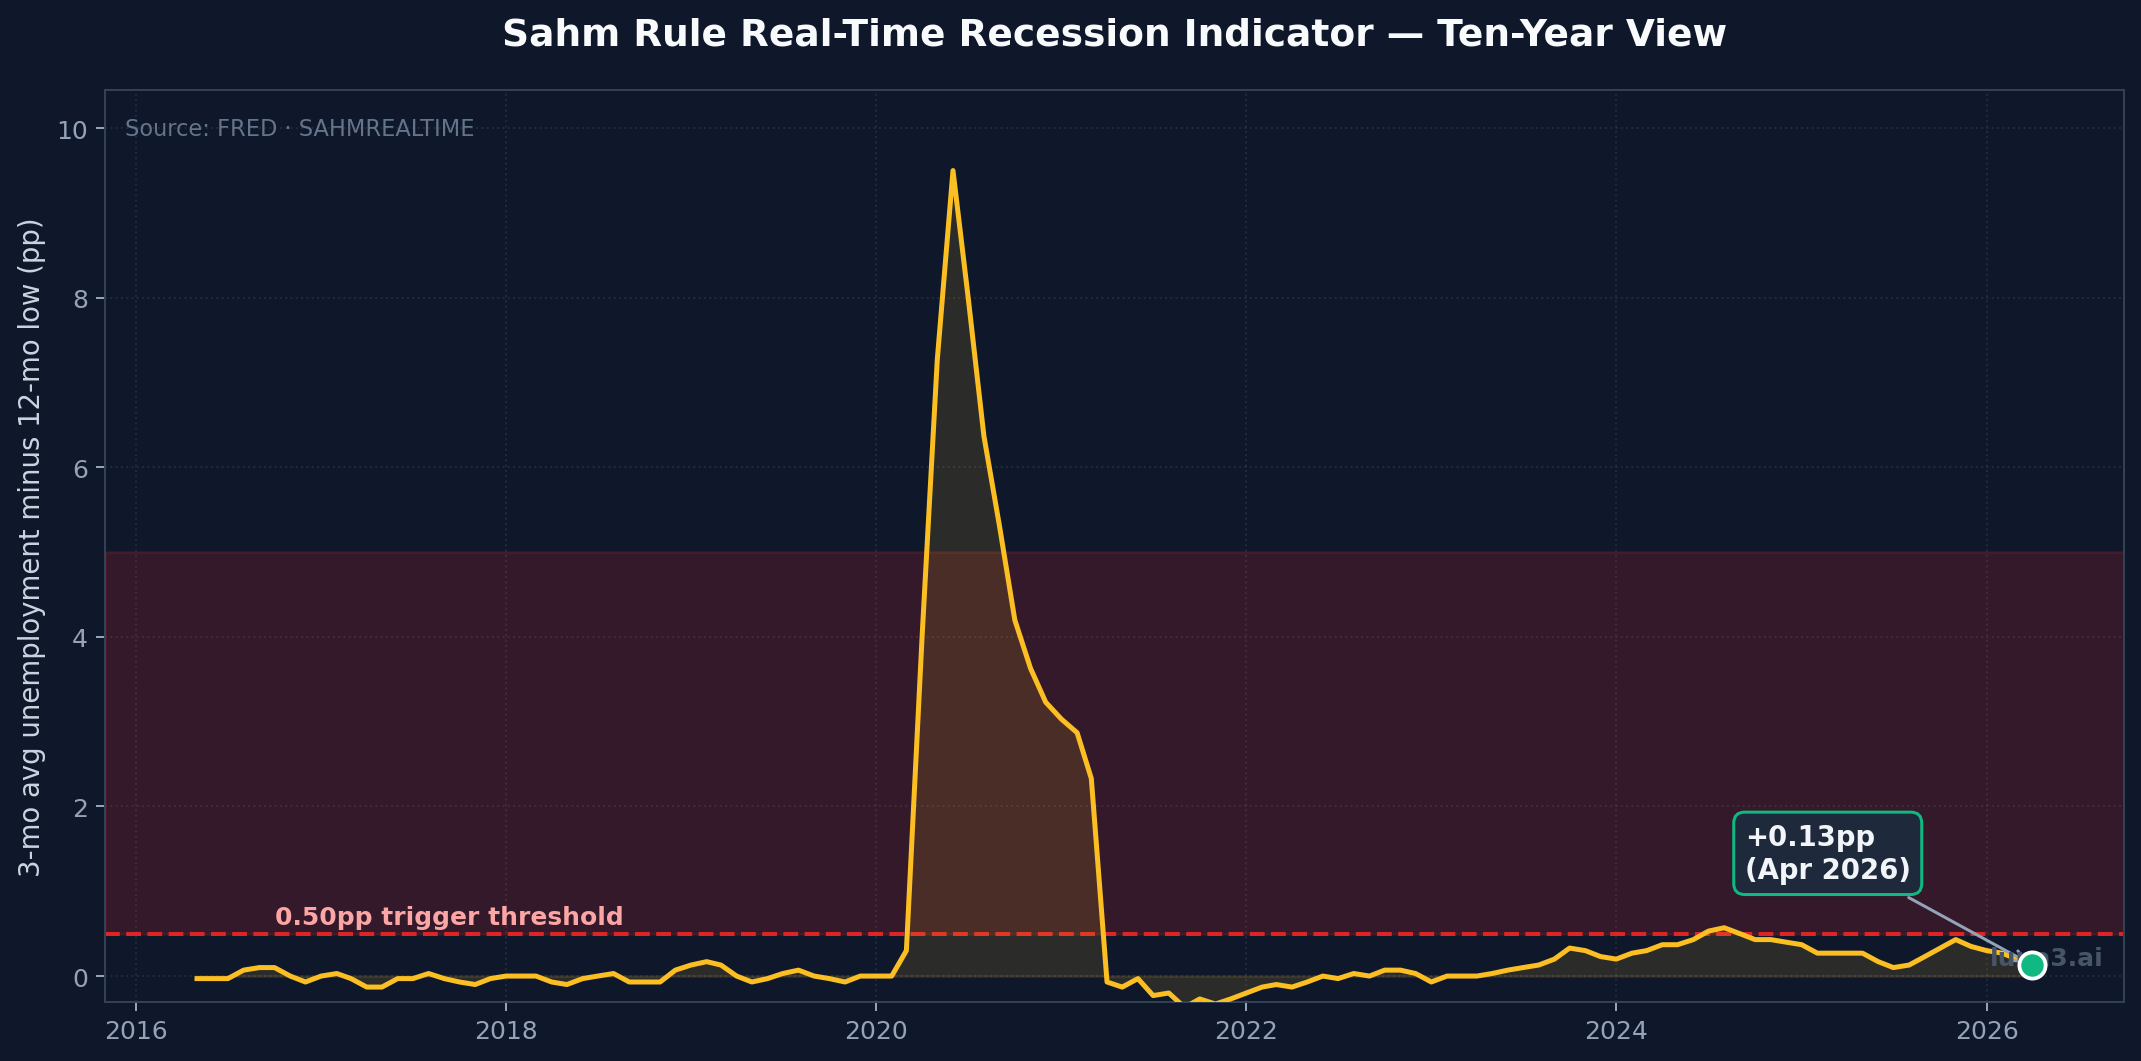
The Sahm Rule was developed by economist Claudia Sahm at the Federal Reserve. It tracks the 3-month moving average of the US unemployment rate (U-3) against its 12-month low. When that 3-month average is 0.50 percentage points or more above the low, the rule signals that a recession is already underway.
Current reading (FRED SAHMREALTIME, April 2026): +0.13pp. Down from +0.20pp the prior month.
That’s well below the +0.50pp trigger. It also isn’t zero — unemployment has ticked modestly off its recent floor.
Sahm herself has been clear about what the rule means and what it doesn’t:
The Sahm rule is an empirical regularity. It is not a forecast.
Claudia Sahm
The rule signals when a recession is already happening, based on the historical pattern that meaningful unemployment increases coincide with the start of recessions. It does not predict future ones. When the reading is +0.13pp, the historical pattern says: not in recession.
For historical context, the Sahm Rule has triggered in 1970, 1974, 1980, 1982, 1990, 2001, 2008, 2020, and 2024 — coinciding with recession in all but the 2024 case, which remains contested (many economists argue it was a false positive driven by labor-supply expansion rather than demand weakness). Either way, the historical false-positive rate is two events since 1959 — both triggered slightly early, but a recession followed within months.
A +0.13pp reading isn’t a warning in the strict sense. It’s a small, sub-trigger number. In 11 prior recessions, the rule didn’t trigger until unemployment had moved meaningfully off the floor. We’re well shy of that.
What credit spreads are telling us
High-yield credit spreads are the early-warning system that picks up trouble before equities do. When companies start to look risky, lenders demand more compensation for holding their debt — and that shows up in the spread between high-yield bond yields and Treasury yields.
The ICE BofA US High Yield Index option-adjusted spread (FRED: BAMLH0A0HYM2) sits at 2.76% as of May 2026.
Historical context, per PitchBook: the 500 basis point (5%) level acts as a structural threshold. Spreads below 500bp tend to find resistance there; spreads above tend to find support there. Above 800bp typically coincides with or precedes recessions. The 2008 and 2020 crises saw spreads above 1,000bp.
At 2.76%, we’re not just below the 500bp threshold — we’re roughly half of it. Credit markets are pricing in low default risk and confidence in corporate health. If growth were genuinely deteriorating, this is the indicator that would move first. It isn’t.
Economy check: what five signals are telling us
Here’s the full board:
| Signal | Reading | Context | Verdict |
|---|---|---|---|
| Yield curve (10Y-3M) | +0.92pp | Steepening after 16-month inversion ended Nov 2023 | ✓ Expansion |
| SPY trend | Bullish (above 200-day MA) | Equity index at or near highs | ✓ Expansion |
| HY credit spread (OAS) | 2.76% | Tight; >500bp = stress; >800bp = recession territory | ✓ Expansion |
| VIX (5d avg) | 17.8 | Near long-run mean ~19.5; well below 25-30 alarm zones | ⚠ Watch |
| Sahm Rule | +0.13pp | Below +0.50pp trigger; well below historical recession-coincident levels | ⚠ Watch |
Four constructive. Two elevated but well shy of their thresholds. The credit and yield-curve backbone — the two most historically reliable signals — sits firmly in expansion territory.
The two watch indicators are doing what watch indicators do: signaling that conditions could change. They are not signaling that conditions have changed.
What could invalidate this
This is where most macro analysis falls down — refusing to engage with what would prove the view wrong. Here are the specific moves that would flip the read:
- Sahm Rule moves from +0.13pp toward +0.35pp without a labor-market recovery — would suggest the unemployment uptick isn’t noise. Historical pattern: trigger follows quickly once the rule starts climbing.
- HY credit spreads widen above 400bp — would mean credit markets are repricing default risk. This is the canary; if it moves, equities follow.
- Yield curve re-inverts (10Y-2Y turns negative again) — would suggest the steepening was a head-fake and Fed cuts haven’t anchored long-end expectations.
- VIX sustains above 30 for three-plus weeks — past 30 isn’t repricing, it’s regime change. That level is associated with growth shocks, not normal market noise.
Any one of those would change the read. Two together would force it.
What we’re watching
The five-signal economy check is a snapshot. The state of play matters more than the picture. Things worth tracking week-over-week:
- Monthly NFP reports. The unemployment rate trend feeds the Sahm Rule directly. A sustained rise from ~4.1% toward 4.5%+ would push the rule reading higher fast.
- Weekly HY OAS prints. The earliest mover. If the spread widens 50–75bp inside a few sessions on no clear catalyst, that’s worth attention.
- 10Y-2Y yield spread. Currently +0.53pp. If it rolls back toward zero, the steepening recovery thesis weakens.
- VIX direction. Does it mean-revert toward 15 (calm) or break toward 25 (concern)? Either resolves the current ambiguity.
- CPI and the Fed nexus. Hot CPI prints that force the Fed to delay or reverse cuts would compress the yield curve and could lift the VIX simultaneously. That’s the cleanest path from current conditions to a regime change.
For investors thinking about portfolio positioning, the read suggests growth-oriented setups remain favored. How macro regime shapes sector selection walks through how a constructive backdrop tends to favor cyclical and growth exposure over defensives. Defensive allocations make sense as a hedge against the watch signals materializing — not as a primary positioning call.
Catalysts to watch
- Next NFP print — single most impactful release for the Sahm Rule and the broader labor read.
- Next CPI print — drives Fed cut expectations, which drive the yield curve.
- Next Fed meeting and dot plot update — will define whether the curve continues to steepen or flattens again.
- Any sudden credit event — high-profile default, sector-specific stress in private credit — would test whether the tight HY spread reflects real strength or is just lagging behind reality.
The data has been clear for months: the US economy is in expansion. The Sahm Rule reading is real but small. The VIX is up but not panicked. The yield curve has steepened and credit is tight. That’s not a recession setup. That’s an expansion with two indicators worth keeping eyes on.
Get early access to Orbit
Orbit is Luna3.ai’s AI-augmented research engine. 12 algorithmic signals + a gradient-boosted ML model + an agentic LLM that reads each top pick’s filings and writes a daily thesis with conviction score and catalyst proximity. Three regimes, three playbooks — growth in expansion, defensives in late-cycle, recovery plays at panic bottoms. The 3 in Luna3.ai.
No spam. Unsubscribe any time.
No comments yet. Be the first to share your thoughts!