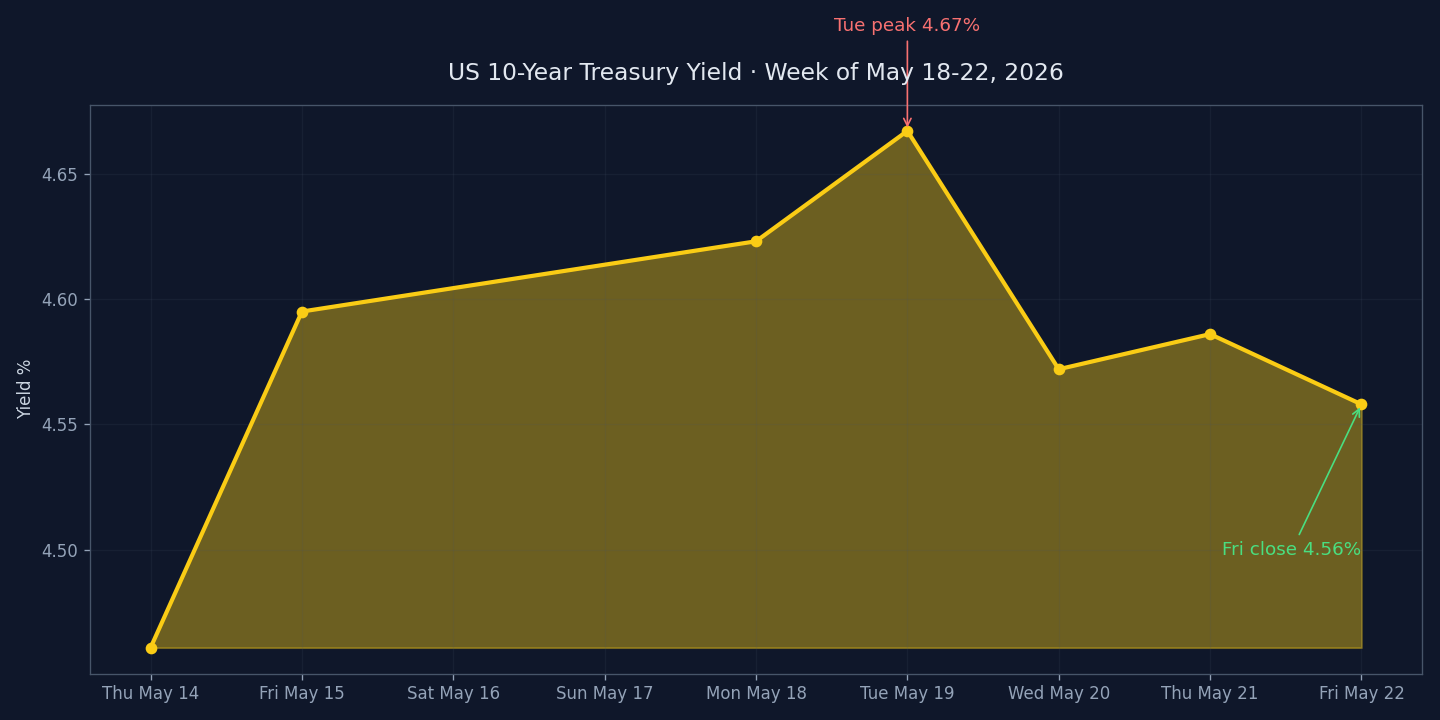
- Yields panic-spiked midweek (30-year touched 5.20%, a 19-year high) but fully reversed by Friday close — the duration scare ended where it started.
- Oil round-tripped DOWN 5-8% on the week as Iran negotiations progressed; midweek peaks of $112 Brent / $109 WTI fully unwound by Friday.
- Credit spreads didn't flinch (IG corporates +0.47%, high-yield +0.57%) even as duration screamed — the tell that this was a rates scare, not a credit scare.
Tuesday looked like the top. Friday looked like nothing happened. Kevin Warsh took the Fed oath into a tape that healed itself. This week’s market pulse digest traces a sequence: panic, then reversal, then a quiet up week for equities that closed out an eight-week streak.
The 30-year Treasury yield touched 5.197% on Tuesday — its highest level since July 2007, a near-19-year peak. By Friday’s close, it had given back seven basis points to settle at 5.06%. The 10-year did the same dance: 4.69% intraday Tuesday, 4.56% at Friday’s bell, three basis points lower on the week than where it started. The “bond market is breaking” narrative spent Tuesday and Wednesday dominating financial Twitter and was effectively retired by Friday lunchtime.
Market Pulse Digest: what moved this week
Bonds. 10-year yield -3bp on the week (4.59% to 4.56%). 30-year yield -7bp on the week (5.13% to 5.06%), despite the Tuesday spike to 5.20%. The Bloomberg US Aggregate (AGG ETF) gained 0.43% — bonds finished slightly POSITIVE on the week. If you read only Wednesday’s headlines, you missed the resolution.
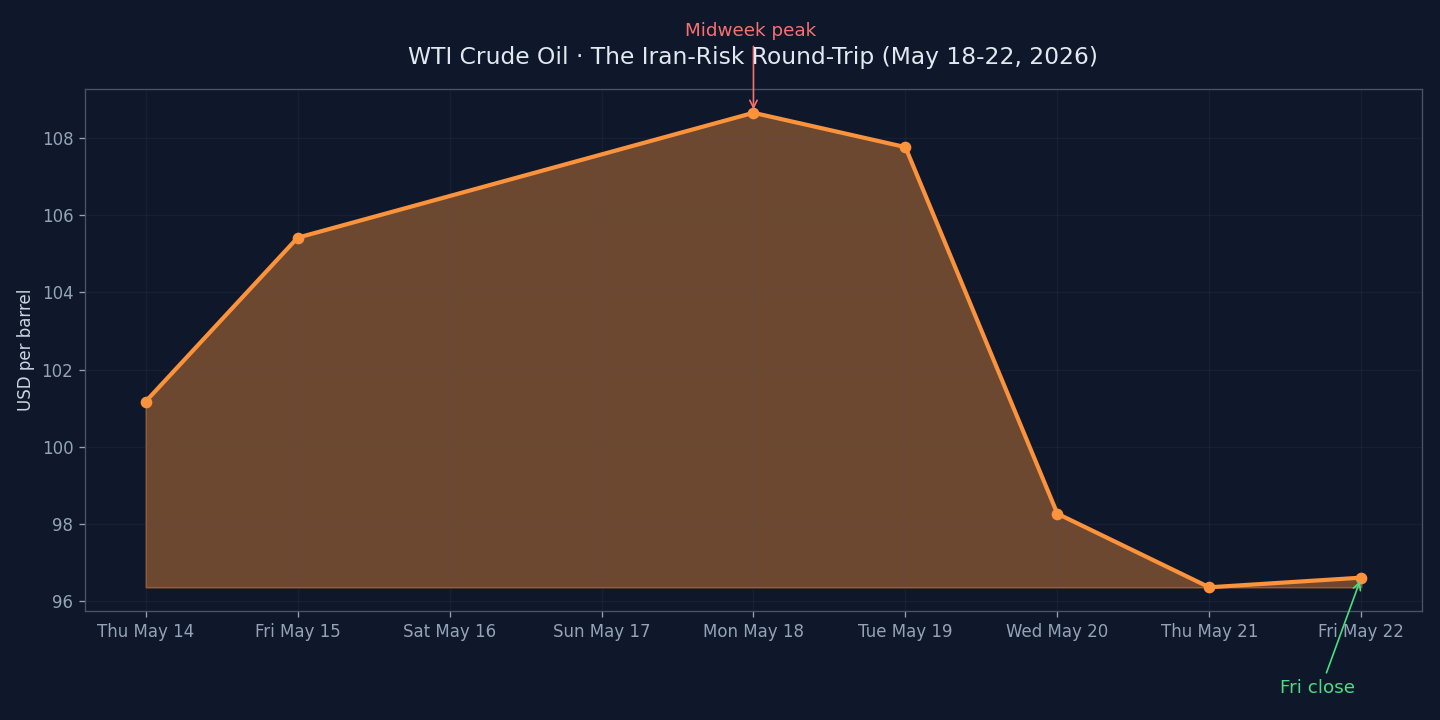
Oil. The round-trip is the chart. Brent touched $112.69 intraday midweek on Iran-strike fears; WTI hit $109.47. By Friday’s close, Brent had fallen to $103.54 (-5.24% week) and WTI to $96.60 (-8.37% week) as Trump postponed military action and U.S.-Iran negotiations progressed. The geopolitical risk premium that built up Monday-through-Wednesday fully bled out by Friday afternoon.
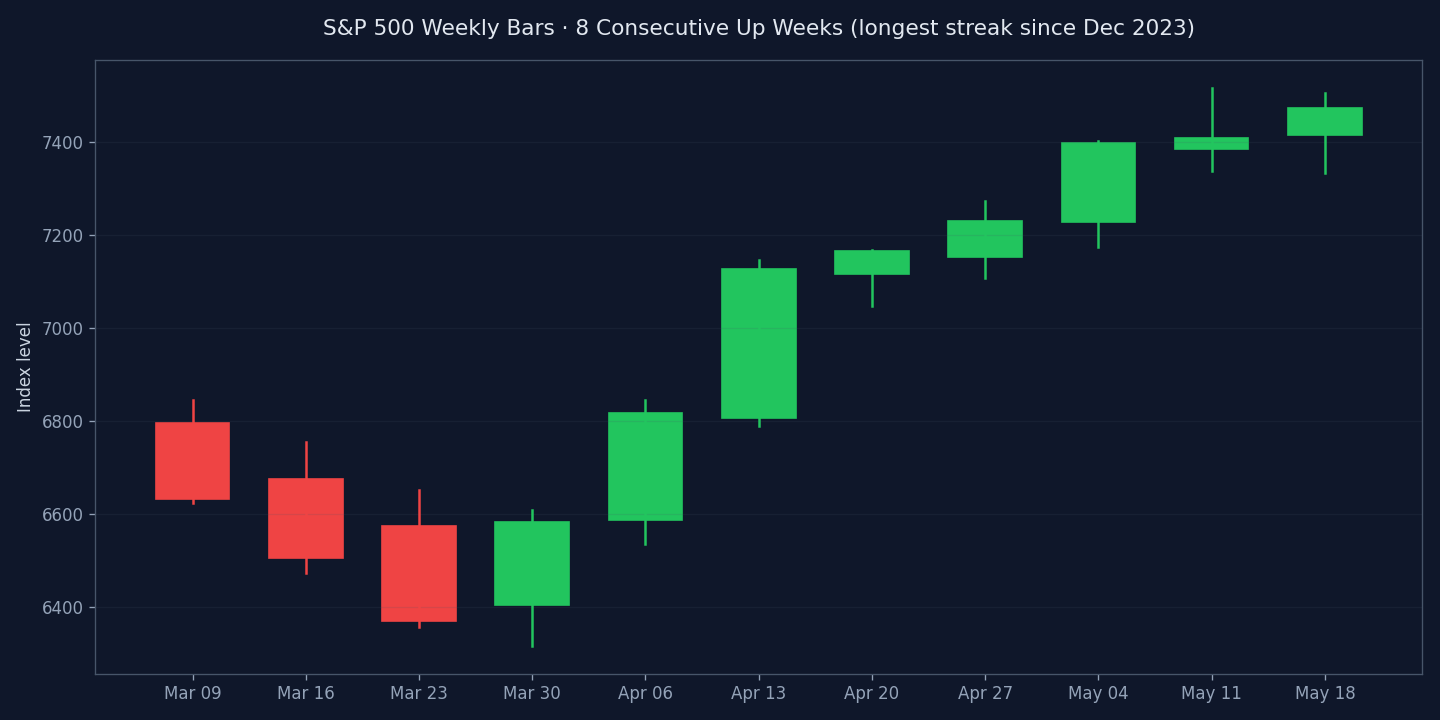
Equities. S&P 500 +0.88% week to 7,473.47 — its eighth consecutive positive week, the longest streak since December 2023. Nasdaq +0.45% week to 26,343.97 (seventh up week in eight). The index-level moves understate the dispersion: hardware names exploded, the AI trade took a breather, and traditional defensives quietly led.
Sector leaders (weekly close-to-close). Utilities +3.37%, Healthcare +3.30%, Tech +2.34%, Energy +0.08% (flat, despite Friday’s intraday bounce — the round-trip in oil neutered the sector for the week). Utilities and healthcare led with the rate-sensitive cohort, which sat oddly against a backdrop of midweek yield panic. By Friday, the rate reversal vindicated them.
Single-stock notable. Dell ripped 21.98% on the week, hitting a record high near $298 intraday, on the back of Lenovo’s blowout China numbers and the hardware-cycle tape. HP Inc. +21.29% on the same Lenovo tailwind. Merck +9.90% on positive trial data. NVIDIA -4.43% — the AI trade took a breather as the hardware bid rotated to PC OEMs. Internationally, the Nikkei 225 added 3.14%, a standout in a week when most developed markets ground sideways.
Earnings backdrop. FactSet’s running tally has Q1 2026 blended earnings growth at +28.4% year-over-year — the highest reading since Q4 2021, and well above the 5-year average of 16.4%. With roughly 90% of the S&P 500 reported, the EPS surprise rate is running 20.7% above estimates. The “expensive market” framing has at least one foot on solid ground.
What didn’t move — and why it matters
Credit spreads. Despite the midweek 30-year panic to 5.20%, investment-grade corporate bonds (LQD ETF) gained 0.47% on the week. High-yield (HYG) added 0.57%. If credit had blown out — even 10 to 15 basis points of IG spread widening — the equity shrug would have cracked. The fact that spreads ignored the duration carnage is the tell.
This was a duration scare, not a credit scare. Two very different things. A duration scare prices a higher discount rate against the same future cash flows — stocks should sell off, and they did, briefly, midweek. A credit scare prices a higher probability that the cash flows don’t show up at all — that’s the one that historically takes equities down hard. The bond vigilantes spent the week shouting; the credit market didn’t even look up. The S&P’s eight-week streak survived intact because the credit market refused to ratify the panic. Worth bookmarking the distinction for the next time yields spike.
Warsh takes the oath
Friday’s other story: Kevin Warsh took the oath at the White House as the eleventh Fed chair of the modern era, sworn in by Justice Clarence Thomas. It was the first Fed-chair swearing-in held at the White House since Alan Greenspan in 1987 — a symbolic choice the market mostly ignored. “Our mandate at the Fed is to promote price stability and maximum employment,” Warsh said. The institutional-independence question is the macro tail risk of the year; we’ll track it through his first FOMC meeting and his first public remarks on rate policy.
On the calendar
- Warsh’s first guidance. Any FOMC-adjacent commentary will reset the curve. Market is leaning dovish into his opening week — that’s the consensus to fade or follow.
- April PCE data. The Fed’s preferred inflation gauge. After April CPI surprised at 3.8% YoY, a hot PCE print re-lights the duration trade and pulls forward the next yield-spike attempt.
- Iran negotiations. The Strait of Hormuz risk premium bled out of oil this week. Any breakdown reopens the spike — and unlike last week, the equity market would notice.
- Earnings tail. Final 5-10% of S&P 500 to report; aggregate Q1 EPS growth holding at +28.4%.
- Hardware follow-through. Does the Dell + HP bid hold or fade once Lenovo’s tape fades? Watch for spread between PC OEMs and NVDA as the tell.
One read for the weekend
Bloomberg’s coverage of Warsh’s swearing-in is the piece worth reading: “Trump Tells Warsh to Do ‘Own Thing’ as Fed Chair Sworn In”. The “own thing” framing is what bond markets are pricing as a coin-flip risk — whether independence holds, or whether it doesn’t. Both Friday’s biggest stock movers piece and the Friday open take are sitting on this same week’s tape — different lenses on the same week we just digested. For the equity-shrug-through-duration-scare mechanic specifically, the VIX term structure piece from earlier in the week explains why volatility refused to flare even as long-end yields panicked.
The week ended where it started — but with one more confirmation that credit, not duration, is the equity market’s actual referee. We’ll be watching whether that holds through PCE and Warsh’s first guidance window.
Get early access to Orbit
Orbit is Luna3.ai’s AI-augmented research engine. 12 algorithmic signals + a gradient-boosted ML model + an agentic LLM that reads each top pick’s filings and writes a daily thesis with conviction score and catalyst proximity. Three regimes, three playbooks — growth in expansion, defensives in late-cycle, recovery plays at panic bottoms. The 3 in Luna3.ai.
No spam. Unsubscribe any time.
No comments yet. Be the first to share your thoughts!