
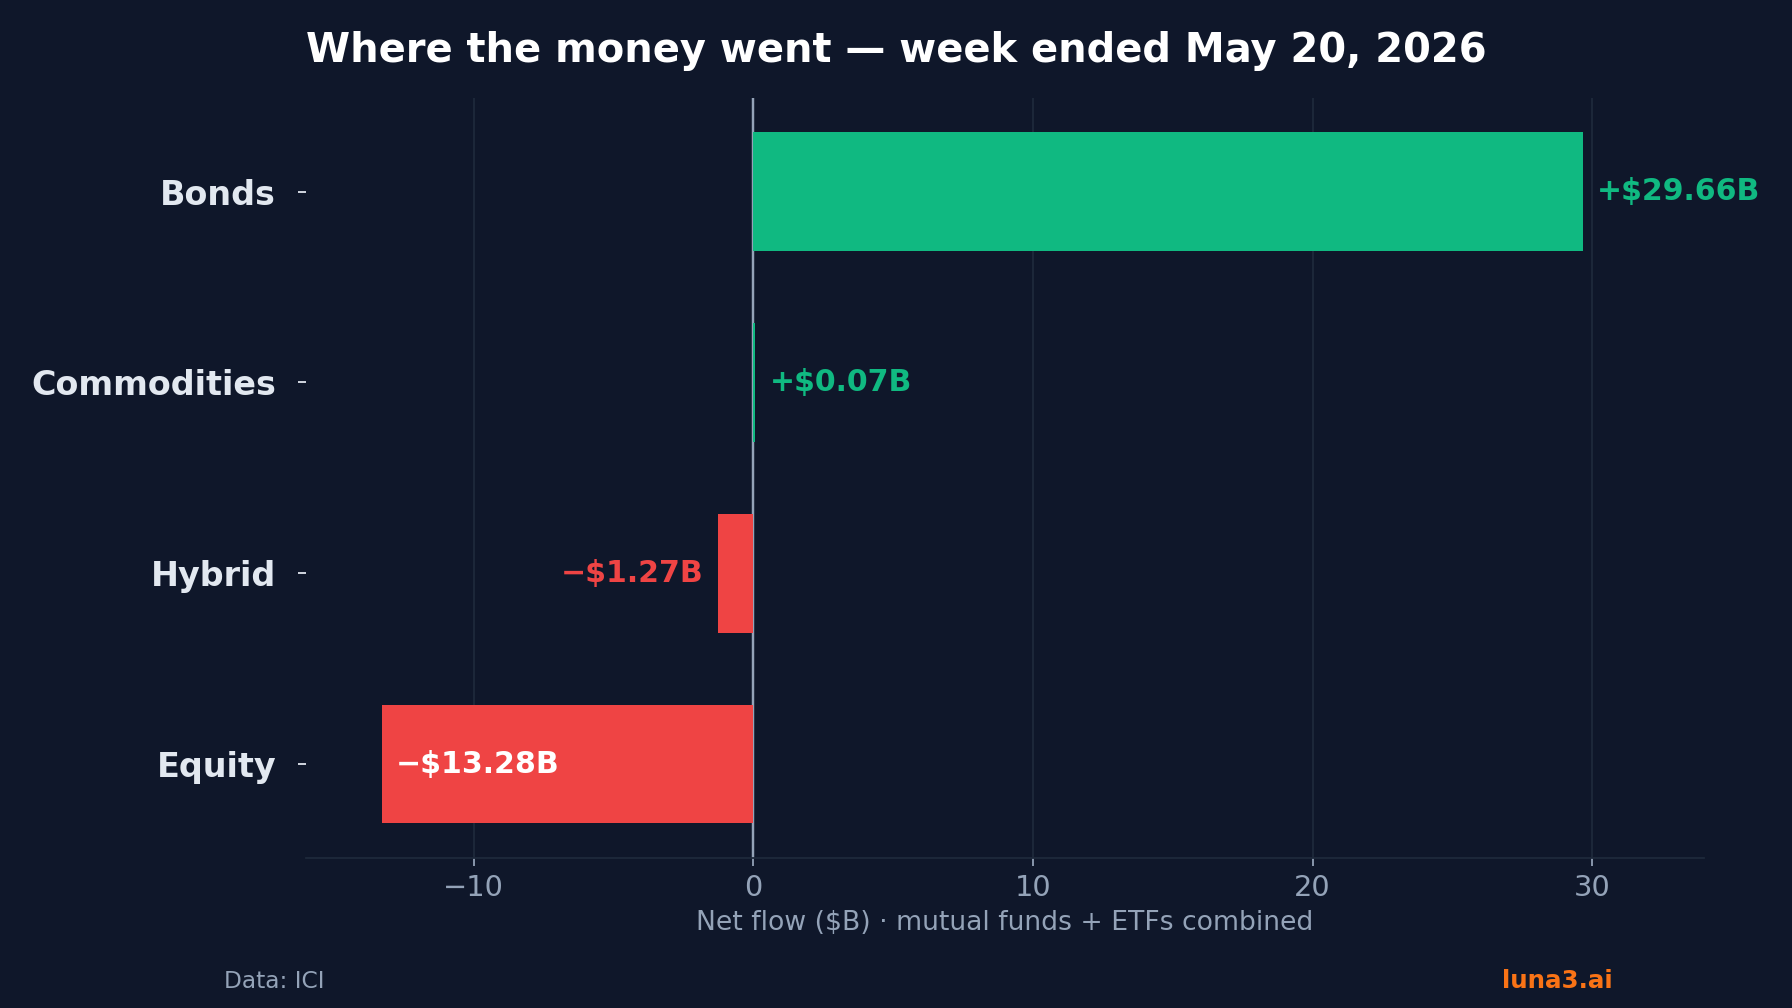
- In the week ended May 20, bond funds drew roughly $30 billion while stock funds shed about $13 billion — the cleanest risk-off rotation print of 2026.
- Fixed income now accounts for about 31% of this year's ETF flows, and active ETFs set a Q1 record (+$245B) even as active mutual funds bled $332B.
- The momentum trades cooled: gold logged its first monthly ETF outflow of the year and bitcoin ETFs gave back most of 2026's inflows.
April’s ETF flows were a tech story. May’s were a rotation story. Last month, US ETFs pulled in a record $167.2 billion — the biggest monthly haul since late 2020 — and the AI and semiconductor trade did most of the lifting, with the Invesco QQQ Trust alone taking $10.1 billion, its best month on record. We mapped that surge in detail in our look at April’s record AI and tech ETF inflows. May didn’t undo it. It rotated it.
Flows are the most honest signal in markets because they are money, not opinion — every dollar that creates or redeems an ETF share is a position someone actually took. So when the same money that chased a 15% QQQ month starts buying Treasury bills instead, it is worth a closer look. Here is the full cross-category map of where the money moved in May: equities, bonds, gold, crypto, and the active-versus-passive divide. (New to how this plumbing works? Start with what an ETF actually is.)
Where the ETF flows actually went
The single cleanest print came in the week ended May 20. ETFs still took in $32.5 billion of net new money that week — the wrapper itself never stopped growing. But across the broader fund universe that the Investment Company Institute tracks weekly, combining mutual funds and ETFs, the split was stark: stock funds shed $13.28 billion while bond funds absorbed $29.66 billion. Within equities, domestic funds lost $11.75 billion and world funds $1.53 billion. Within bonds, taxable strategies took $26.29 billion and municipals another $3.37 billion. Hybrid funds gave back $1.27 billion; commodities barely moved.
The daily texture told the same story. On May 5, US fixed income ETFs pulled $4.85 billion against $2.46 billion for US equity ETFs. Even the single biggest creation of the day — $1.48 billion into the Vanguard S&P 500 ETF — sat right beside a 0–3 month Treasury fund and a small-cap index fund on the leaderboard. Cash was coming in, but it was buying ballast as readily as beta.
Two things were happening at once, and it is worth separating them. The ETF wrapper itself kept pulling money in — that $32.5 billion of weekly net issuance is creation outpacing redemption across every asset class combined. What rotated was the mix inside it: the dollars that arrived increasingly wanted bonds, not stocks. A growing pie re-sliced toward safety is a more interesting signal than a shrinking one. It says investors aren’t leaving markets — they’re repositioning within them.
Fixed income’s record run
May didn’t start the bond bid — it extended it. Fixed income ETFs have taken in more than $202 billion in net new money so far in 2026, roughly 31% of all ETF flows for the year, running at about twice the asset class’s share of total ETF assets. Demand on that scale doesn’t come from a single trade; it comes from a regime where yields are high enough that bonds finally compete with stocks for the marginal dollar.
The texture underneath matters more than the headline. The 2026 story isn’t “buy the Agg” — it’s dispersion. The money has clustered in shorter- and mid-duration strategies, collateralized loan obligations, and income-tilted funds, while leaving long-duration exposure largely alone. Investors are taking the yield without betting the house on where the Fed lands. That is a more durable kind of flow than performance-chasing, and it is the quiet foundation under the whole year.
Where inside fixed income matters too. The money has favored the front and belly of the curve — short-dated Treasury funds like the iShares 0–3 Month Treasury ETF that ranked just behind VOO on the May 5 leaderboard, AAA-rated CLO strategies, and a wave of actively managed core-bond ETFs as issuers race to launch them. Long-duration funds, the ones that would benefit most from aggressive rate cuts, have been left comparatively alone. That is the tell: investors want the coupon, not a leveraged bet on where the Fed lands.
Active ETFs are still winning
One trend cut straight through the rotation: the move into active ETFs didn’t pause for it. In the first quarter, active ETFs gathered $135 billion while active mutual funds bled $332 billion — the clearest snapshot yet of the structural shift from mutual funds into ETFs. It is often the same strategies and the same managers, simply moving into a cheaper, more tax-efficient, more tradable wrapper.
The pace is a record. Active ETFs pulled $245.21 billion globally in the first quarter — up 70% on the prior record set in 2025, per ETFGI — and added another $50 billion in April. The point isn’t any single figure; it’s that the wrapper shift runs independently of which asset class is in favor. Whether the month’s money wants stocks or bonds, it increasingly wants them inside an ETF, and increasingly inside an actively managed one.
The why isn’t mysterious. The in-kind creation-and-redemption mechanism lets ETFs shed taxable gains a mutual fund can’t, the fees are usually lower, and a generation of advisors has rebuilt model portfolios around tickers they can trade intraday. Drop an active strategy into that wrapper and it inherits all three advantages at once. The result is close to a one-way street — even in a month when the asset-class winds shifted from stocks to bonds, the migration from mutual funds to ETFs didn’t so much as pause.
Where the momentum cooled — gold and crypto
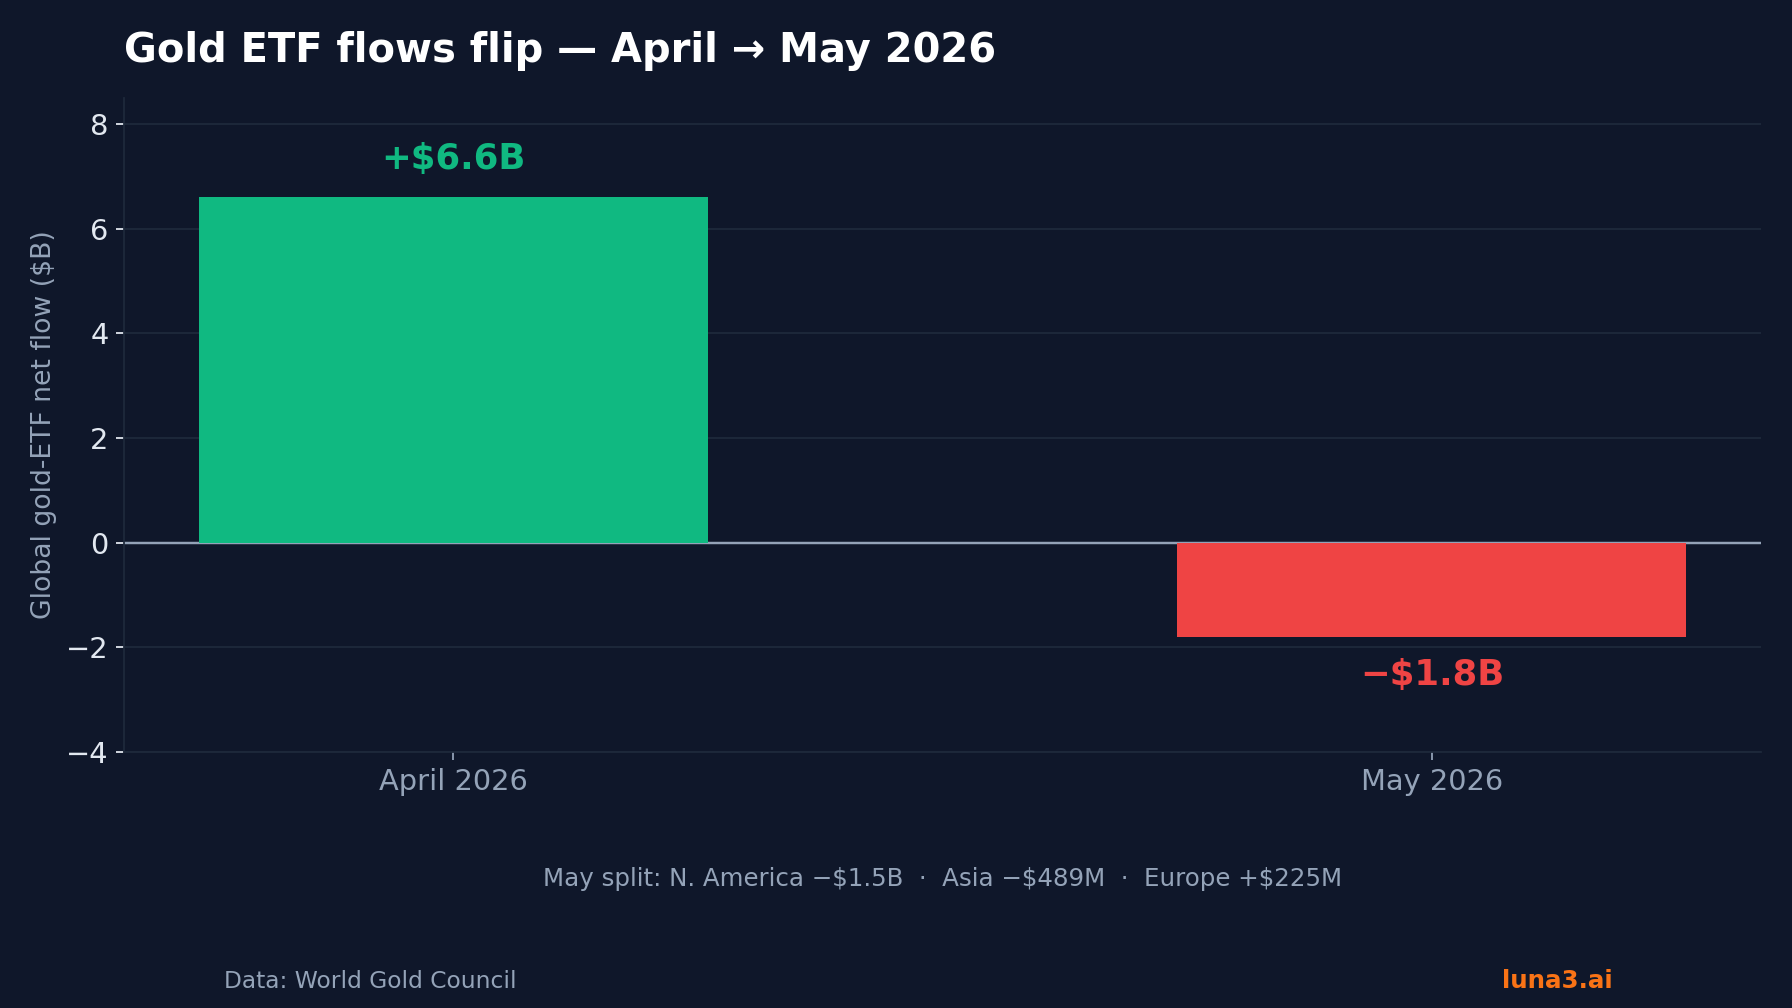
If bonds and active strategies were the magnets, the momentum trades were the source. Gold logged its first monthly ETF outflow of 2026: global gold-backed ETFs shed $1.8 billion in May, according to the World Gold Council’s May flow report, with North America (−$1.5 billion) and Asia (−$489 million) leading the way out and Europe (+$225 million) the lone bidder. Total assets slipped 1% to $374 billion and holdings fell 19 tonnes to 3,541. After April’s $6.6 billion inflow and a strong run earlier in the year, this reads as a profit-taking pause, not a change of regime.
Crypto was the harder hit. US spot bitcoin ETFs shed about $1.55 billion over six straight sessions from mid-May, cutting their 2026 net inflows to roughly $536 million — down from nearly $2 billion — and leaving crypto the only broad ETF category still net-negative for the year. The split inside the category is its own story: Grayscale’s GBTC, at a 1.50% fee, keeps leaking, while BlackRock’s IBIT, at 0.25%, remains the lone fund holding the year’s balance positive at about $2.7 billion of inflows. Bitcoin ETFs were one of 2025’s biggest flow stories, so watching the category flirt with a net-negative year is a reminder that even the highest-profile wrappers answer to the same profit-taking gravity as gold.
The quiet winner — international and emerging markets
The rotation wasn’t only into safety. The year’s most underappreciated flow story is geographic: emerging-market ETFs gathered more than $35 billion in the first quarter alone, already past several recent full-year totals, with demand reaching into single-country funds for markets like South Korea and Brazil. A soft US dollar, improving earnings momentum outside the US, and a renewed appetite for diversification have pulled money toward exposures that spent years out of favor.
A caveat keeps this honest: the $35 billion is a first-quarter, structural figure, not a clean May print — and world-equity funds were actually slightly negative in the May 20 week. The multi-quarter rotation away from US concentration is the real signal; the weekly wobble is noise layered on top. Both can be true at once, which is exactly why the monthly map matters more than any single week.
What the May flow map says
Put the pieces together and May looks less like a top and more like a handoff. Conviction rotated out of price momentum — the April tech and semiconductor surge that cooled almost as fast as it arrived — and into income, safety, active management, and the world outside the US. When money that chased a 15% monthly move pivots into Treasury bills and bond funds within weeks, it suggests a chunk of April’s flow was performance-chasing rather than structural conviction. The unwind was concrete, not abstract: QQQ — April’s $10.1 billion star — shed $3.27 billion in a single session on May 5, the kind of one-day redemption that only shows up when fast money heads for the exit at once.
The next few weeks will settle the question. Watch the final May tallies as the full-month flow reports land in early June, plus the June 16–17 Fed decision and the next round of jobs and inflation prints for the macro read. Three things would change the picture: a return to net equity inflows would frame May as a healthy pause; a widening of the bond lead would confirm a genuine risk-off shift; and a steadying in gold and crypto would say the momentum cohort has found a floor rather than begun a longer unwind. For now, the cleanest read is the simplest one: in May, the flows stopped agreeing with the rally.
Get early access to Orbit
Orbit is Luna3.ai’s AI-augmented research engine. 12 algorithmic signals + a gradient-boosted ML model + an agentic LLM that reads each top pick’s filings and writes a daily thesis with conviction score and catalyst proximity. Three regimes, three playbooks — growth in expansion, defensives in late-cycle, recovery plays at panic bottoms. The 3 in Luna3.ai.
No spam. Unsubscribe any time.
No comments yet. Be the first to share your thoughts!