- The US interconnection queue stands at ~2.3 TW (LBNL 2025 Edition, end-of-2024) — still twice the entire installed US grid, with average waits now near five years.
- The real AI buildout bottleneck is transmission, transformers, and substation gear — not SMRs or gas turbines. Standard power transformers now ship in 128 weeks (~2.5 years) per Wood Mackenzie's Q2 2025 survey.
- The cleanest exposure runs through transmission EPCs (PWR, MYRG), grid-equipment OEMs (GEV's grid segment, HUBB, ETN), and specialty electrical names (ATKR, NVT) — not the reactor cohort.
The “AI needs nuclear” thesis has been told to death — small modular reactors, behind-the-meter PPAs, gas turbine backlogs. It is also half the story. AI data center power is no longer constrained by generation. It is constrained by the wire between the generator and the rack — and by the queue you have to sit in before you are even allowed to plug in.
As of Lawrence Berkeley National Lab’s latest “Queued Up” study (2025 Edition, end-of-2024 data), roughly 2.3 TW of generating capacity is stuck in US interconnection queues — still about twice the country’s entire installed grid, even after a 12% withdrawal-driven decline from end-of-2023’s 2.6 TW peak. A typical project reaching commercial operation in 2024 spent 55 months (~4.5 years) in the queue; projects built in 2000–2007 averaged under two years. Dominion now tells Northern Virginia data center developers that anything above 100 MW should plan on a seven-year total wait. Microsoft and Meta have started relocating planned sites away from constrained territory.
Every “AI factory” pitch assumes the electron can reach the rack. The choke point isn’t the reactor. It is the wire and the queue. The investable angle runs through transmission EPCs, grid-equipment OEMs, and specialty electrical names — most of which don’t show up in the usual AI-trade screen.

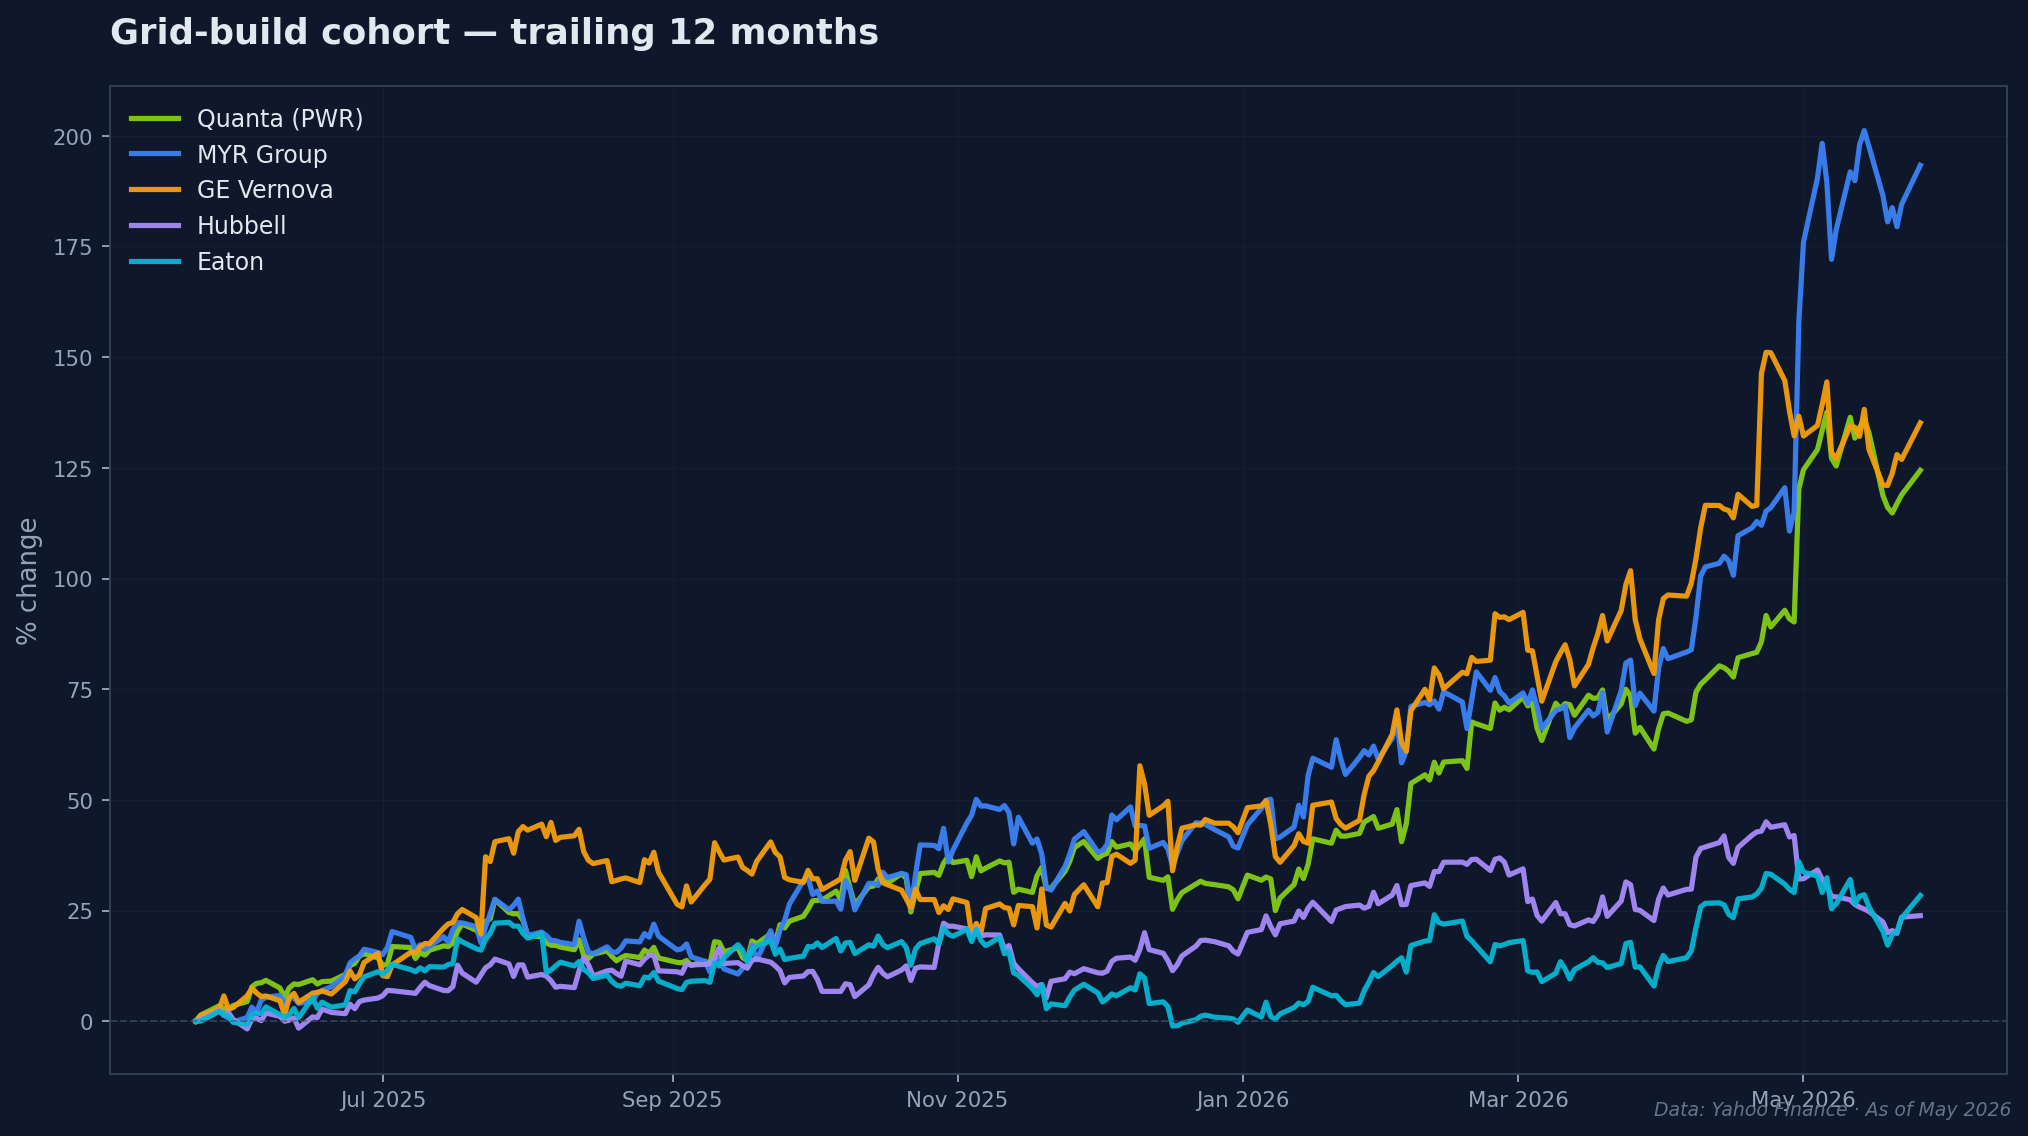
Quanta Services — ticker PWR — last printed $740.46 going into publication on May 27, 2026, and is up roughly 165% over the trailing two years as the transmission build-out thesis has compounded. That run is not a bet on AI directly. It is a bet on the wire that has to reach the AI rack.
Why AI data center power is now the binding constraint
Hyperscaler capex is approaching ~$700B in aggregate 2026 guidance across Microsoft, Meta, Amazon, and Alphabet — confirmed across the Q1 2026 print cycle. On our prior hyperscaler capex breakdown we framed this as a chip-supply problem. Twelve months on, it isn’t. Nvidia’s most recent earnings call made the language explicit: today’s AI data centers are “constrained by power and capital,” and Jensen Huang reframed the optimisation problem from chip list price to lifetime cost per token of intelligence produced. That is a power-economics statement dressed as a productivity statement.
Two structural pressures are stacking simultaneously. First, the interconnection queue is already at multi-decade highs — LBNL data shows queue growth has actually accelerated since FERC Order 2023 took effect (Nov 6, 2023; compliance deadline April 2024), not slowed. Second, every major ISO with hyperscaler exposure — ERCOT, PJM, MISO — has revised AI load forecasts upward in the last six months. The math doesn’t reconcile without either much faster transmission build-out or much more behind-the-meter generation. Both involve the same names.
The reactor story still matters — see our SMR-for-AI thesis and GEV’s gas turbine backlog piece for the generation side. But generation is the input. The grid is the bind.
How AI data center power actually reaches the rack
Strip away the press-release language and the chain from generator to GPU rack has exactly four links:
- Generation. Gas, nuclear, solar, wind, soon-to-be-commercial SMRs. The story everyone tells.
- Transmission lines. High-voltage HVAC or HVDC corridors moving bulk power. Designed and built by EPCs — Quanta (PWR), MYR Group (MYRG), MasTec (MTZ).
- Substations and transformers. Where high-voltage bulk power steps down for distribution. Hardware made by GE Vernova’s Grid Solutions segment, Hubbell (HUBB), Hitachi Energy, ABB, Schneider Electric.
- Last-mile distribution and on-site power. UPS, switchgear, cable management, conduit — Eaton (ETN), nVent (NVT), Atkore (ATKR).

The constraint binds on steps two and three. Standard power transformers now average 128 weeks of lead time per Wood Mackenzie’s Q2 2025 survey; generator step-up units run 144 weeks; specialised orders stretch to 36–48 months. HVDC converter station construction itself takes 4–5 years, but the permitting and right-of-way work in front of construction often runs 7–10 years from filing to energization. Even if you have the transformer order in and the reactor financed, you cannot turn on the rack until the corridor is permitted, the converter station is built, and the substation has been tied into the ISO.
This is why “build more SMRs” — even at the pace bulls forecast — does not solve the AI build-out timeline by itself. Even on-site SMRs still need to interconnect for redundancy and excess sell-back. Even fully behind-the-meter generation requires substation upgrades. The grid layer gates the rack either way.
By the numbers — what the queue, the wait, and the CAPEX actually show
- Queue depth: ~2.3 TW active queue per LBNL 2025 Edition (end-of-2024); down 12% YoY from 2.6 TW (end-of-2023) as withdrawal rates spiked. Solar ~956 GW; storage ~890 GW; natural gas ~136 GW (up 72% YoY).
- Average wait: 55 months to commercial operation for projects coming online in 2024. Only 13% of capacity that requested interconnection between 2000 and 2019 had reached commercial operation by end of 2024. Seventy-seven percent was withdrawn.
- Transmission CAPEX: US investor-owned utilities spent $32.6B on transmission in 2024, up 8.7% from $30.0B in 2023 (EEI). 2025 projection: $39.9B. Combined 2025–2028 plan: ~$178B on transmission construction.
- Equipment lead times: 128 weeks standard transformer; 144 weeks GSU; ~$2B already committed to North American transformer manufacturing expansion to break the supply ceiling. Capacity additions don’t arrive until 2028.
- ERCOT 2031 peak demand forecast: 218 GW (vs 94 GW in 2025) — more than doubled. The data center component alone grew from ~30 GW (2024 forecast) to ~78 GW (2025 forecast). Even under ERCOT’s conservative adjusted methodology, peak hits 145 GW by 2031.
- ERCOT large-load queue: 233 GW of interconnection requests as of December 2025; over 70% from data centers.
Read those numbers as a system: the queue is bigger than the grid, the wait is longer than a hyperscaler’s planning horizon, the long-lead hardware is sold out, and the demand forecast keeps revising upward. Generation can’t be the binding answer — it never enters the equation until step three.
Where the money flows — the four-layer build-out
The leverage to the grid-build cycle isn’t evenly distributed. Different layers capture margin at different points and on different timing.
Layer 1 — Transmission EPC contractors (the picks and shovels)
- Quanta Services (PWR): the largest electric infrastructure EPC in North America. 2024 revenue mix per the 10-K: Electric Power Infrastructure Solutions 47.2%, Renewable Energy Infrastructure 33.1%, Underground Utility 19.7% — combined ~80% electric and renewable build-out exposure. Multi-year backlog near record highs. Doesn’t care which generator wins, only whether the wire gets built.
- MYR Group (MYRG): pure-play transmission and distribution construction. Smaller-cap than PWR, higher beta to the cycle. The cleanest mid-cap proxy for the same trade.
- MasTec (MTZ): transmission segment growing fast but combined with energy pipelines, so the cycle exposure cuts both ways.
Layer 2 — Grid equipment OEMs (the long-lead hardware)
- GE Vernova (GEV): the Grid Solutions segment — HVDC converters, transformers, FACTS, switchgear. Already covered on our gas turbine backlog piece; the grid segment is the under-discussed second leg of the same thesis.
- Hubbell (HUBB): electrical components, utility distribution gear, T&D fittings. Smaller scope than GEV but cleaner US-listed exposure.
- Eaton (ETN): electrical power management. Sells into both the utility room of the substation and the floor of the data center. Among the few names with both Layer 2 and Layer 4 exposure.
- Hitachi Energy (private subsidiary of Hitachi 6501.T), ABB (ABB), Schneider Electric (SBGSY): global incumbents. ABB and Schneider trade as US ADRs; useful for completeness, less obviously the cleanest exposure than a pure-play US name.
Layer 3 — Specialty and commodity electrical
- Atkore (ATKR): electrical conduit, raceway, fittings. High-margin commodity, lower beta than the EPCs, cleaner pure-play.
- nVent Electric (NVT): enclosures, cable management, fasteners. Sells directly into the data center power infrastructure as well as into the substation.
Layer 4 — Utilities serving hyperscaler regions
- Dominion Energy (D): Virginia — the host of Loudoun County’s Data Center Alley, the densest concentration of data centers anywhere on earth (49 million square feet, ~5,000 MW of installed capacity — more than double Beijing).
- American Electric Power (AEP): PJM service area plus a transmission build-out arm.
- Constellation Energy (CEG): the marquee behind-the-meter operator — owner of the 20-year Microsoft PPA at the Crane Clean Energy Center (the Three Mile Island Unit 1 restart, 835 MW dedicated to Microsoft, targeting 2027–2028 restart).
- Vistra (VST): Texas (ERCOT) combined nuclear, gas, and now behind-the-meter PPA strategy.
The framing matters: the EPC layer (PWR, MYRG) is the cleanest beneficiary of queue clearing and rising transmission CAPEX — they don’t care which generator wins the corridor, only that someone is paying to build it. Equipment OEMs (GEV Grid, HUBB, ETN) capture margin on the long-lead orders. Utilities are tertiary plays — they are regulated, so upside is capped by the rate-case mechanism. But their behaviour determines how much of the wire gets built, and which behind-the-meter deals close.
What could break this — the counter-trades
- Behind-the-meter generation bypasses the grid entirely. The Constellation–Microsoft Crane deal, the Talen Energy–Amazon Susquehanna deal, the new wave of SMR + hyperscaler agreements — these put the generator on the data center site with minimal grid touch. If 30%+ of new hyperscaler power becomes behind-the-meter, the transmission EPC story narrows from a structural trade to a partial one.
- Permitting reform actually works this time. FERC Order 2023 has not yet broken the queue. A more aggressive federal preemption — siting authority, NEPA reform, expedited transmission lines of national interest — could shorten timelines and compress the urgency that supports the EPC backlog story.
- AI demand forecasts overstate. If hyperscaler capex normalises (margin compression, training-to-inference economics shift, regulatory headwinds), the upward load revisions reverse. The thesis weakens — though more slowly than the chip cohort, because grid lead times are long enough that a 2026 demand correction wouldn’t reach the EPC backlog until 2028–2029.
- Transformer supply unlocks faster than consensus. The $2B in announced North American transformer manufacturing expansion (Hitachi Energy, Siemens Energy, Eaton) is targeted at 2028. If those facilities ramp early, the 128-week lead time compresses, and the price-of-iron mark-up the OEMs are currently capturing comes down.
- Hyperscaler self-generation goes further than expected. Microsoft has filed for SMR development authority; Amazon has acquired nuclear-adjacent sites. If the on-site model becomes default rather than exceptional, the grid story flips from structural multi-decade to cyclical 5-year.
Signals worth watching
- LBNL “Queued Up” Annual Study — published around Q2 each year; the load-bearing data source. Look for queue depth, average wait time, and withdrawal rate.
- FERC Order 2023 implementation tracker — ISO-by-ISO compliance progress; the leading indicator of whether queue reform is actually working.
- ERCOT and PJM regional planning documents — load forecast revisions and transmission planning updates. ERCOT’s 2025 long-term forecast (218 GW by 2031) is the document that reset the AI load conversation.
- PWR, MYRG, GEV bookings backlog in quarterly earnings — the leading indicator. The EPCs book orders 4–6 quarters before the work hits the income statement.
- Hyperscaler PPA announcements — every new behind-the-meter deal tells you which way the constraint is being routed around (grid clearance vs grid bypass).
- Transformer order lead-time updates — quarterly EEI and SEMA briefings; Wood Mackenzie’s surveys are the cleanest external snapshots.
Bottom line
The AI infrastructure trade has been told as a chip-supply story, then a power-generation story, and now — quietly — as a grid story. The market is most of the way to pricing the first two. It is only beginning to price the third. The wire that has to reach the rack runs through EPCs that don’t sound like AI plays, equipment OEMs whose lead times are measured in years rather than quarters, and a handful of utilities whose service territories happen to overlap with the world’s densest data center clusters. The names show up in the same screens, with the same earnings beats, regardless of whether the reactor on the other end of the wire is from Westinghouse or from a hyperscaler’s R&D budget.
The choke point isn’t the reactor. It is the queue and the corridor. The leverage sits with whoever builds them.
Get early access to Orbit
Orbit is Luna3.ai’s AI-augmented research engine. 12 algorithmic signals + a gradient-boosted ML model + an agentic LLM that reads each top pick’s filings and writes a daily thesis with conviction score and catalyst proximity. Three regimes, three playbooks — growth in expansion, defensives in late-cycle, recovery plays at panic bottoms. The 3 in Luna3.ai.
No spam. Unsubscribe any time.
No comments yet. Be the first to share your thoughts!