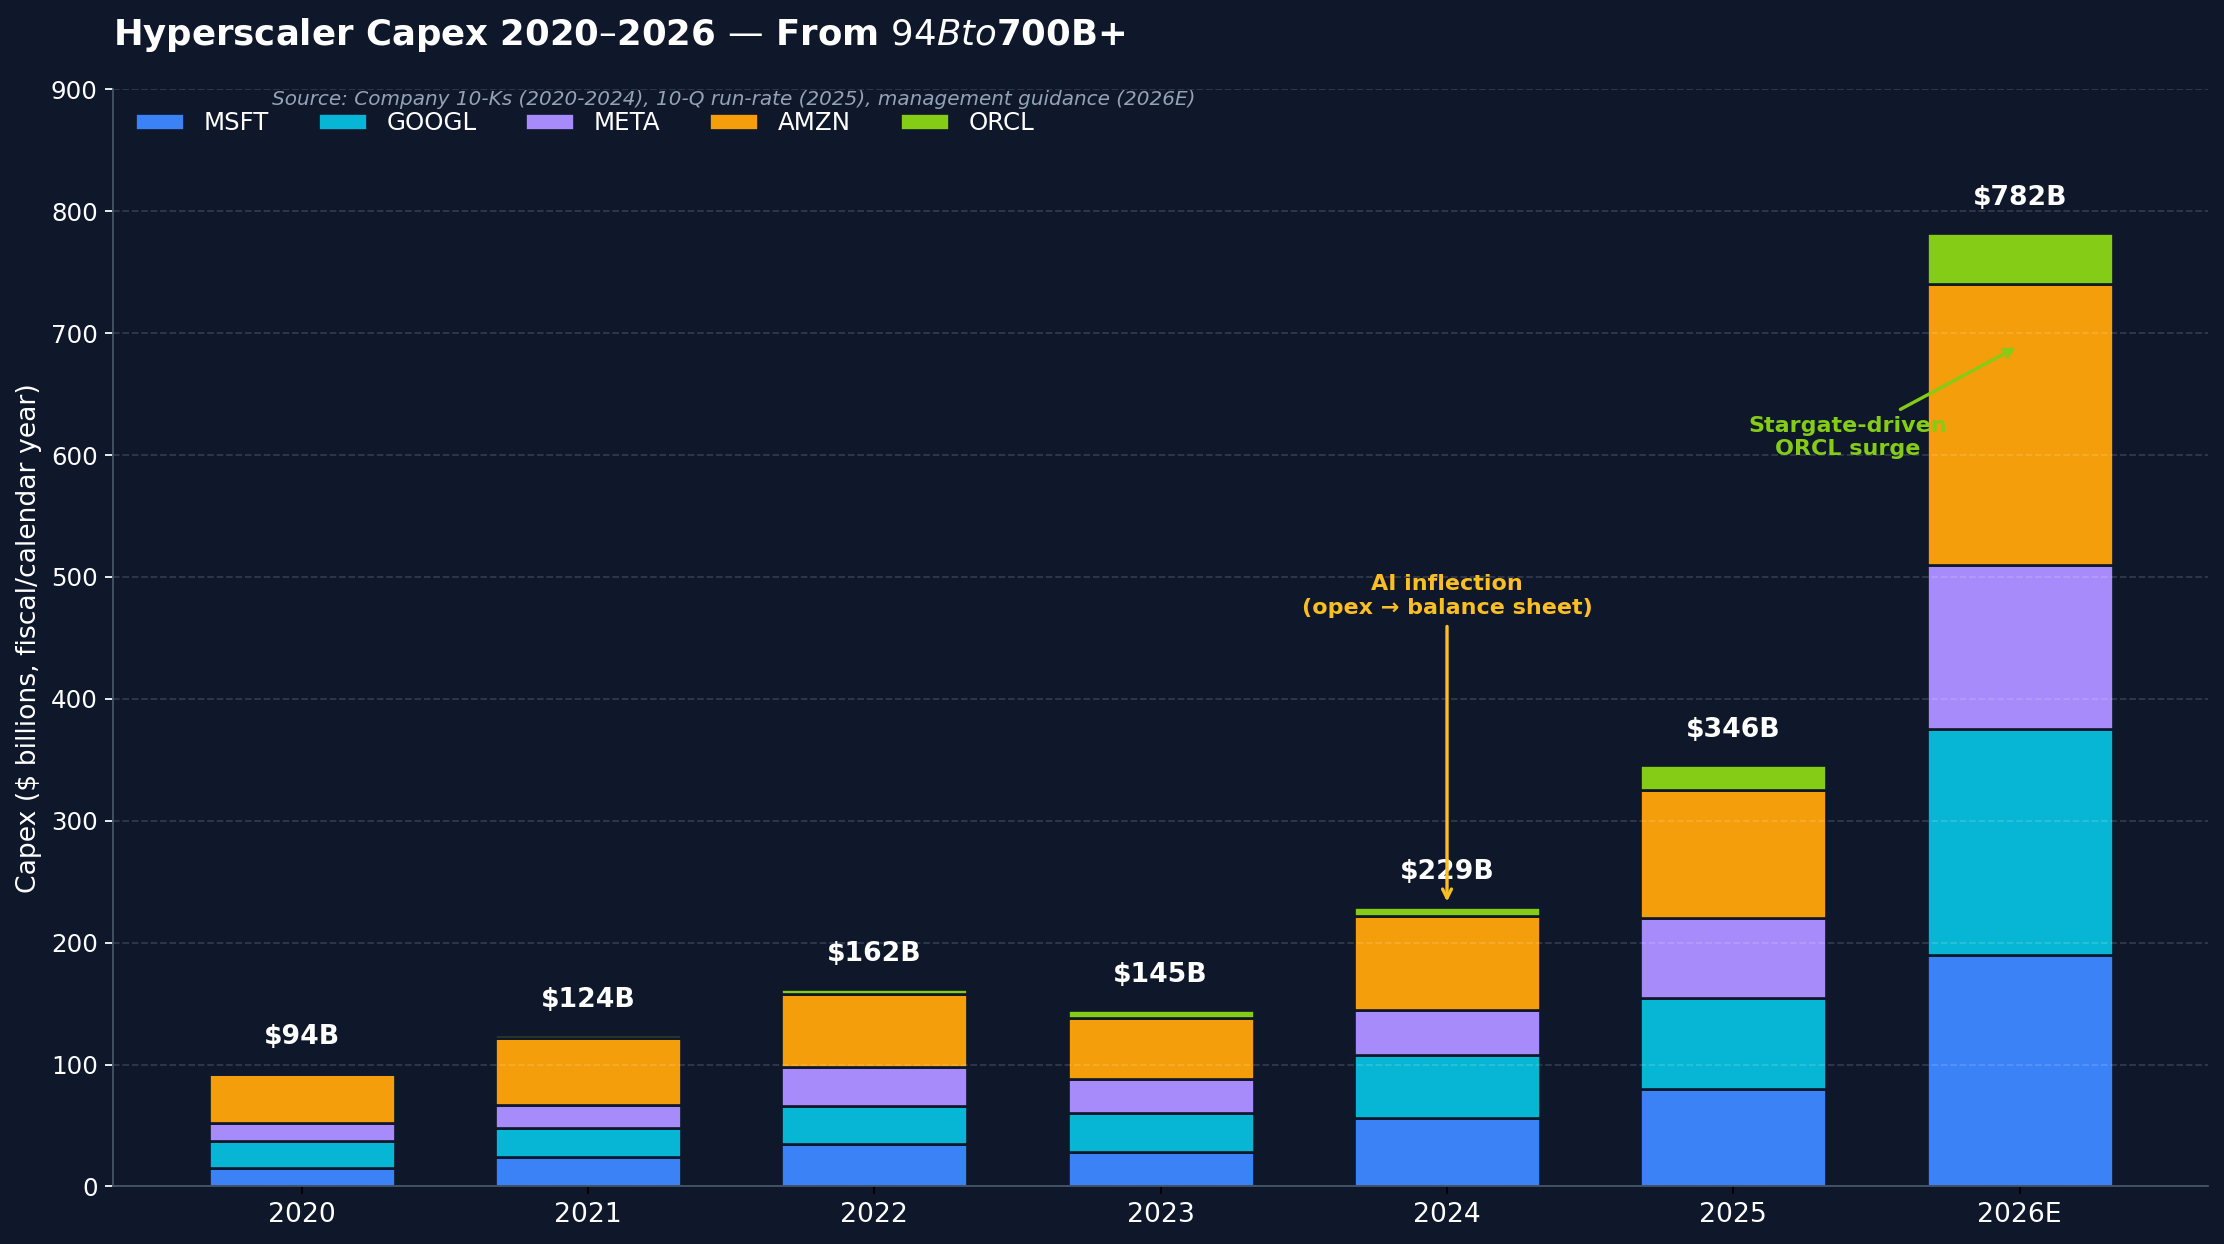
- Combined 2026 capex from Microsoft, Meta, Google, Amazon and Oracle is on track to exceed $700 billion — more than the entire 2024 global semiconductor industry took in revenue.
- Roughly one-third of that goes to GPUs and custom AI accelerators per Dell’Oro, making this line the most leveraged single number in tech today.
- The supply chain captures the revenue: NVDA, AMD, TSM, ASML, MU, AVGO, MRVL, Vertiv, Constellation Energy, EQIX and more all sit downstream of one cohort’s spending decisions.
Five US-listed companies — Microsoft, Meta, Google, Amazon and Oracle — are on track to spend more than $700 billion on hyperscaler capex in 2026. That is more than the entire 2024 global semiconductor industry took in revenue ($627 billion per WSTS), and it is more than 25 times what ExxonMobil spent on its entire 2024 cash capex line. Almost every other line item in tech earnings — NVDA data-centre revenue, TSM utilisation, Vertiv backlog, Constellation Energy’s long-dated power-purchase agreements — is a derivative of this one number.
Microsoft, the bellwether of the cohort, last printed $407.77 going into publication on May 20, 2026 — and it sits at the centre of the story. The company just guided $190 billion in fiscal 2026 capex, more than double the prior year’s $80 billion, with CFO Amy Hood acknowledging that gross margins are already compressing by roughly 110 basis points as the depreciation cliff arrives. What follows is a map of where the $700 billion actually lands — and which buckets compound the fastest from here.
Why hyperscaler capex matters now
We have lived through a decade where the dominant framing of US tech equity was “capital-light SaaS”. That framing is broken. Dell’Oro Group reports the top-four US cloud service providers — AMZN, GOOGL, MSFT and META — grew data-centre capex 76% in 2025, while Oracle more than tripled its number to fund the Stargate project. Microsoft alone has guided $190 billion for fiscal 2026 capex, up from $80 billion in FY2025. Amazon Web Services is running over $230 billion. Meta has lifted its 2026 range to $125–145 billion. Google sits in the $180–190 billion zone. Combined with Oracle’s $35–50 billion, the five-name cohort is on a 2026 run-rate that CNBC and CreditSights peg at over $700 billion, with some forecasters projecting closer to $830 billion at the high end.
The cycle is at a critical inflection. 2024 was opex-led — hyperscalers were largely renting NVDA capacity, and the cost passed through the income statement as gross-margin pressure. 2025 and 2026 are balance-sheet-led: hyperscalers now own the silicon, the racks, the buildings, the long-dated power contracts, and increasingly the custom chips themselves. That balance-sheet shift is what is driving the depreciation cliff — and it is the part of the story retail investors most consistently miss.
Microsoft is the easiest place to see it. CFO Amy Hood acknowledged on the Q3 FY2026 call that gross margin had compressed to 67.6%, down from 68.7% in the same quarter a year prior — roughly 110 basis points of margin gone, with management guiding that the pressure would “remain under pressure for the next several quarters.” Two-thirds of the company’s 2026 capex is going to short-lived assets — GPUs and CPUs that depreciate over three to five years — so the expense compounds quickly. The cash spent today shows up in the P&L for several years.
How hyperscaler capex actually works
Dell’Oro is the cleanest public source for breaking the capex line apart. Their most recent quarterly read states that GPUs and custom AI accelerators now account for roughly one-third of total data-centre capex — making them the single largest component in any hyperscaler’s quarterly capital outlay. CreditSights’ aggregate work, summarised in a December 2025 IEEE post, frames it slightly differently: roughly 75% of hyperscaler spend is what they call “AI infrastructure” — servers (with the GPUs inside), data-centre facilities, networking gear, electrical equipment. The remaining ~25% goes to general cloud and corporate uses.
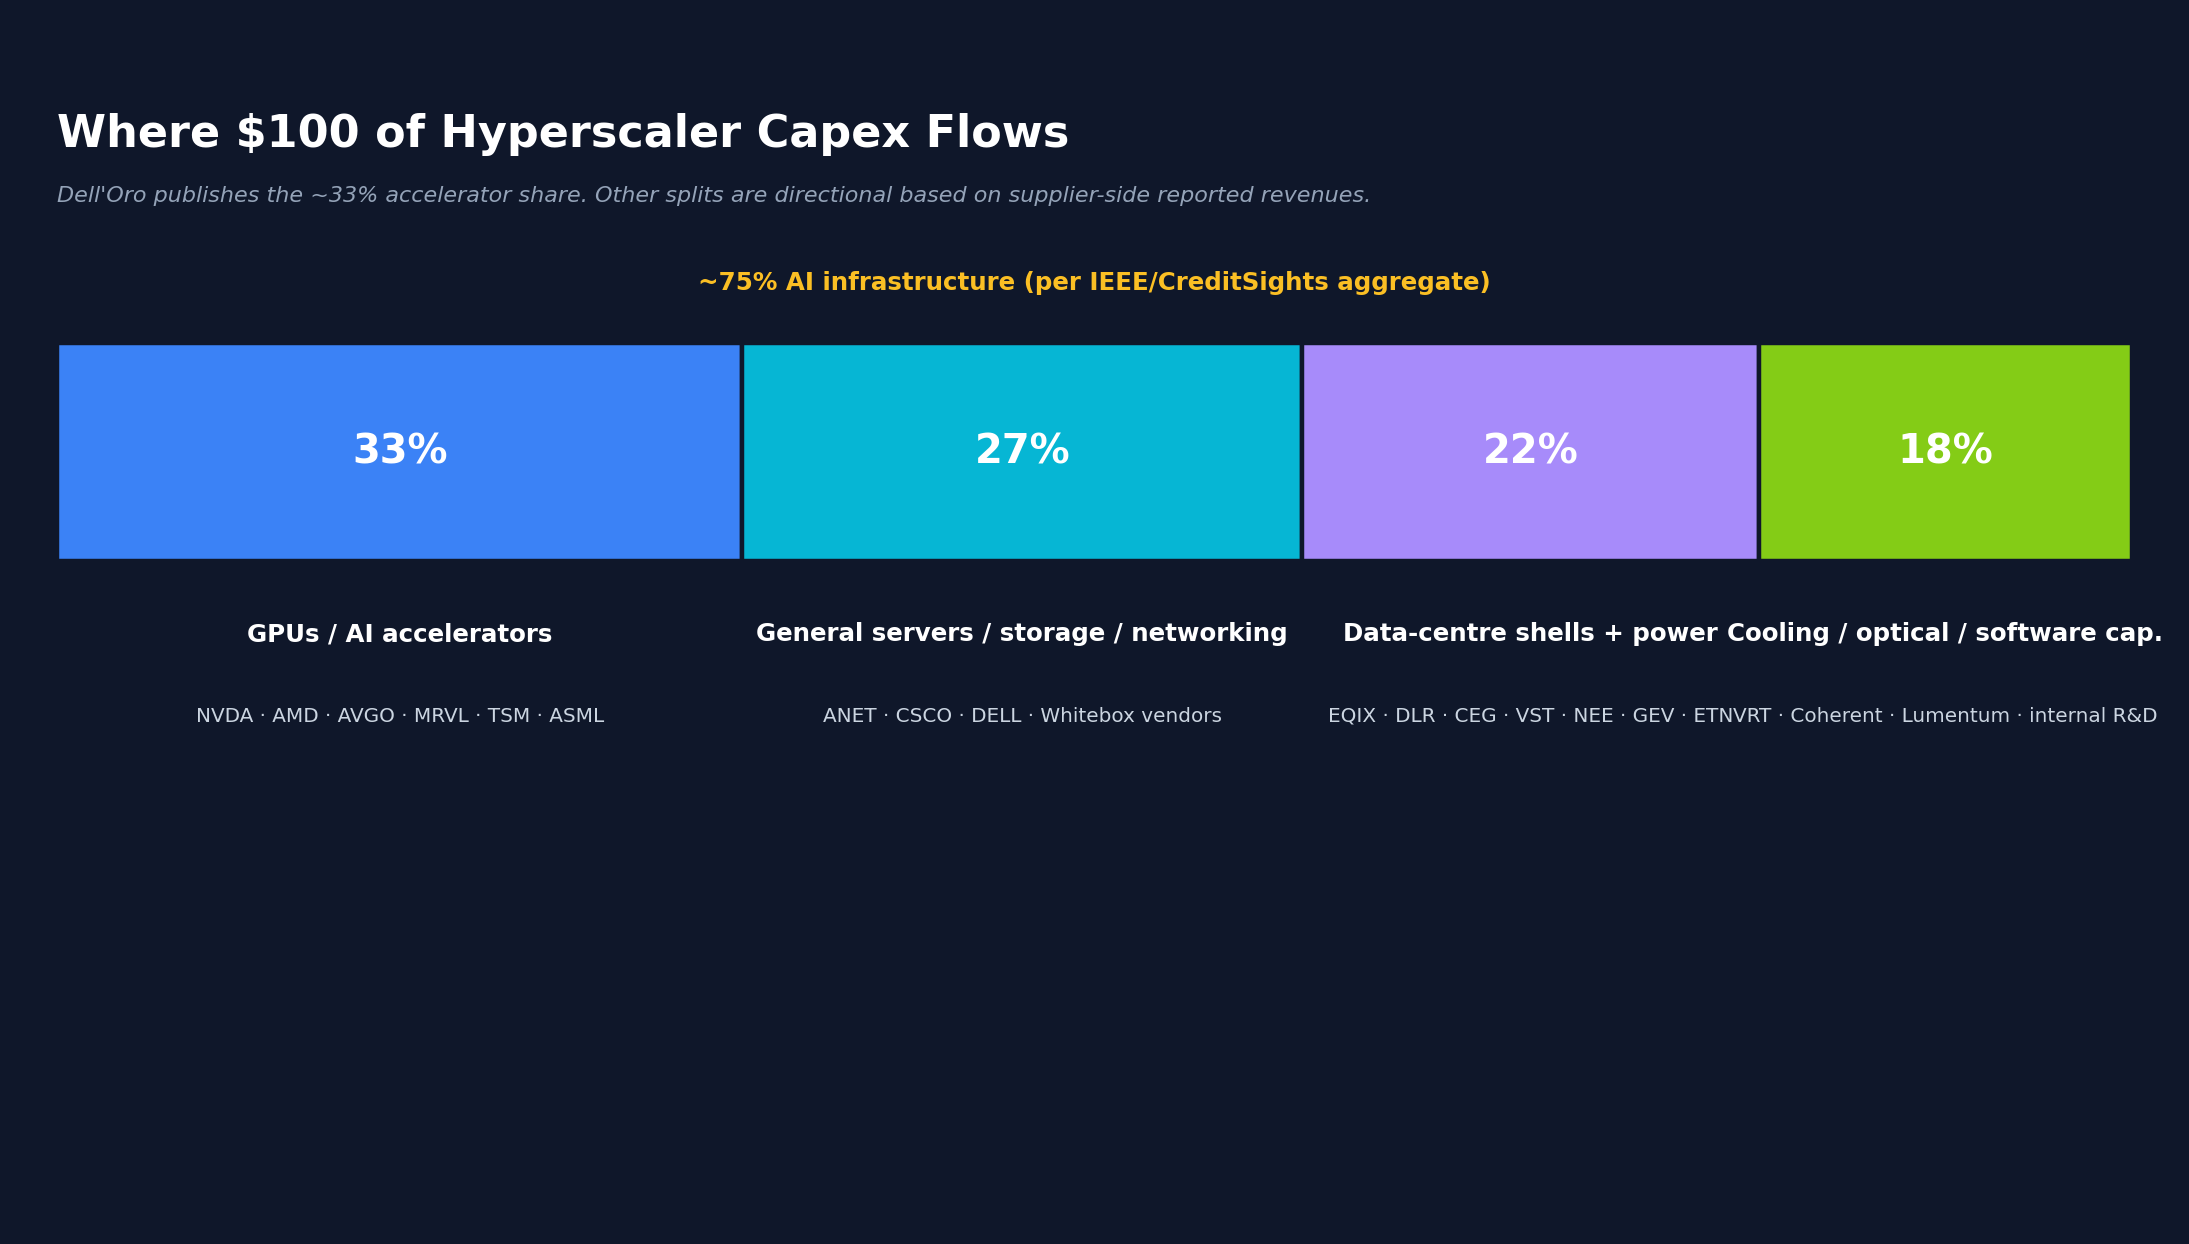
Underneath that headline split sit four practical buckets that drive the supplier-side revenue numbers:
- Compute and accelerators (~33% of total). Where NVDA, AMD, TSM and ASML earn their data-centre revenue. Custom silicon (AVGO with Meta’s MTIA, MRVL with AWS Trainium) is an increasingly important parallel track inside this bucket.
- General servers, storage and networking. White-box vendors captured more than 60% of the server market in 2025 per Dell’Oro. Arista (ANET) and Cisco (CSCO) are the public-equity beneficiaries on the high-speed networking side.
- Physical shells, power infrastructure and cooling. Land, concrete, electrical substations, liquid cooling for high-density AI racks. Vertiv (VRT), Eaton (ETN), GE Vernova (GEV) and the data-centre REITs Equinix (EQIX) and Digital Realty (DLR) are the public proxies.
- Software and R&D capitalisation. Smaller line, mostly internal-build capitalisation on the hyperscaler’s own balance sheet. Not directly investable but matters for understanding earnings quality.
Memory deserves its own carve-out within compute. HBM (high-bandwidth memory) is the most supply-constrained input in the AI compute stack — see our deep dive on what HBM memory is and why every AI chip depends on it. Micron (MU) just cited multi-year HBM4 supply commitments to multiple hyperscalers in its most recent print. SK Hynix and Samsung are the other two HBM names — both non-US-listed — but the supply-demand tension shows up clearly in Micron’s revenue trajectory.
The cash-to-revenue lag is what makes the cycle so hard to call. Cash spent on a GPU today shows up as depreciation in the P&L for the next three to five years; cash spent on a data-centre shell shows up for eight to fifteen years. So the operating-margin pressure is front-loaded relative to the AI revenue the capex is supposed to generate, and the question every analyst is now asking is whether the AI revenue line catches up before the depreciation cliff forces a slowdown.
Oracle’s arrival in the hyperscaler cohort is the most under-appreciated story of the cycle. ORCL spent under $7 billion in fiscal 2024, then over $21 billion in FY2025, and now has FY2026 guidance that has been revised upward multiple times to a range of $35 to $50 billion — the Stargate project, plus the surge in OCI demand that drove Q1 FY26 remaining performance obligations 359% higher to $455 billion. OCI revenue grew 55% year-on-year in Q1 FY26 and is on track for ~$18 billion in fiscal 2026.
For practical reading of a 10-Q capex line, three things matter most: the sequential pace (quarter-over-quarter is what the supply chain reacts to), full-year guidance revisions mid-year (which signal whether management is leaning in or pulling back), and commentary on lead times (a proxy for how tight supply is — when AWS tells you server lead times are stretching, that is a tell for NVDA’s backlog).
Where the money flows
This is the section that makes the capex line actually investable, because the headline number rarely accrues to the company that spent it. The five-name cohort sets the capex; the supply chain captures the revenue.
Compute and accelerators (the largest single bucket). NVDA is the share leader — its Blackwell Ultra ramp drove Dell’Oro’s reported 76% growth in accelerated-server spending in 2025. AMD is steadily picking up share at the margin with MI300 and MI350. TSM and ASML are the two companies that benefit regardless of which accelerator wins — every advanced-node chip moves through TSM’s fabs, and every EUV-node wafer requires ASML’s lithography. That makes them the cleanest “pick the field” exposure in the cohort.
Custom silicon (the parallel track). AVGO and MRVL are the two public-equity beneficiaries of the hyperscaler “build our own” pressure. Broadcom extended its Meta MTIA partnership through 2029 in April 2026, committing to multi-gigawatts of capacity — Broadcom CEO Hock Tan moved off Meta’s board into a focused advisory role on the silicon roadmap. Marvell signed a five-year multi-generational deal with AWS for Trainium2.0 custom AI ASICs plus optical DSPs, switching silicon and DCI modules. Trefis estimates the AWS-Marvell revenue at roughly $1.6 billion in custom silicon alone, before the broader components. See our companion piece on the custom silicon race between hyperscalers and NVDA.
Memory. Micron is the US-listed HBM beneficiary; the multi-year HBM4 supply commitments mean revenue visibility is unusually long for a memory cycle.
Packaging. CoWoS (chip-on-wafer-on-substrate) is the next bottleneck after HBM and flows entirely through TSM’s revenue — see our deep dive on the CoWoS packaging shortage. On the substrates side, Japanese and Taiwanese names dominate, but the gating constraint is TSM’s CoWoS capacity expansion.
Power and utilities. This is where the supply-chain leverage extends past the obvious tech names. Constellation Energy (CEG), Vistra (VST) and Talen (TLN) have long-dated PPAs with hyperscalers. NextEra (NEE) is the largest renewables operator in the country. GE Vernova (GEV) is selling natural-gas turbines and grid hardware into the data-centre buildout. ETN and PWR are picking up transmission and electrical-infrastructure work. The AI buildout has effectively become a utilities story too — and the utilities trade at a fraction of the multiples NVDA does.
Cooling and networking. Vertiv (VRT) is the cleanest liquid-cooling read; high-density AI racks (50–100+ kW per rack) cannot be air-cooled, and VRT has the installed base. Arista Networks (ANET) sits inside the high-speed Ethernet AI-fabric story that Broadcom is also targeting. Both have benefited from the 76% growth in accelerated-server spending Dell’Oro flagged in 2025.
Real estate. EQIX and DLR are the two data-centre REITs with the deepest hyperscaler tenant exposure. Dell’Oro flagged physical-shell spending as a large component of the non-accelerator ~67%. The REITs are landlords — hyperscaler tenants, multi-year leases, AAA-credit counterparties. A tighter relationship to the capex cycle than most equity REITs.
The pattern across all of these is the same. The capex line is concentrated in five names, but the revenue flows out across a dozen-plus cohorts. The investable angle is rarely “buy MSFT because they are spending $190 billion” — it is “understand where each dollar lands and find the cohort where the leverage compounds.”
What could break this thesis
Capex cycles do not run forever. Four things would slow this one down in a meaningful way:
The ROI question. If the AI revenue line at the hyperscalers — Copilot at Microsoft, AI Overviews at Google, Bedrock at AWS, Vertex at Google, Meta’s recommendation algorithms — does not reach a clear inflection by FY2027, the next capex cycle has to slow or ratchet down. The depreciation cliff makes this asymmetric: management has already committed to the cash outlays, so the costs are coming regardless. If the revenue does not match, operating margins compress structurally and the equity multiples that travel with growth-stock framing reset.
Custom silicon eating NVDA share faster than expected. The Meta-AVGO and AWS-MRVL deals are the leading edge of a hyperscaler trend to vertically integrate the silicon stack. If the mix of custom accelerators inside hyperscaler buildouts moves 10 percentage points faster than current consensus, NVDA’s data-centre revenue growth decelerates — but the broader capex number does not fall, it rotates. NVDA-specific risk, not a sector risk, but for a cohort where NVDA is the anchor it matters.
Power capacity and grid interconnect. PJM Interconnection’s queue for new generation is years long. ERCOT congestion has hit AI data-centre builds in Texas. If the grid cannot keep up with the compute appetite, capex shifts away from compute (NVDA) and toward land and power (CEG, GEV, ETN) — again rotating within the cohort. Some hyperscaler projects have already moved to small-modular-reactor and behind-the-meter generation as a workaround.
China decoupling. Huawei’s Ascend ramp combined with US export restrictions is creating a parallel non-US capex pool largely invisible to US-listed equity. If the Chinese cluster scales faster than expected, it dilutes the global pricing power of the US accelerator names — but at the same time it creates demand for the parts of the stack China cannot easily replace (ASML lithography, TSM advanced-node packaging, certain HBM grades).
A real recession. Capex has historically been the most cyclical line in technology. AI workloads do not immunise against a corporate-IT pullback — they amplify the swing, because hyperscaler customers (the broader enterprise SaaS and ad markets) also reset. The lowest-probability scenario in the current data, but the tail risk that matters most.
What we’re watching
A small list of measurable signals through the rest of 2026:
- Quarterly capex guidance revisions on the four-name US earnings sequence (MSFT, then META, then GOOGL, then AMZN), then ORCL three weeks later. Direction and magnitude of revisions matter more than the absolute numbers.
- NVDA backlog and lead-time commentary in earnings. Stretching lead times mean pull-forward and supply tightness — bullish for NVDA but also bullish for AMD as a second-source.
- TSM advanced-node utilisation prints (monthly). The cleanest tell on the entire AI-compute supply chain.
- Hyperscaler PPA announcements. Every multi-year power-purchase agreement signed between a hyperscaler and a utility is a forward capex signal.
- The Dell’Oro and SemiAnalysis quarterly trackers. Dell’Oro publishes a public press release every quarter; SemiAnalysis is paywalled but the headline numbers leak.
- The 10-K capex line vs the prior year’s management guidance. Whoever overshoots their own guidance the most is signalling the most demand confidence — a useful relative-strength filter on the cohort.
The cohort read is what matters here — never the single-name trade. The five hyperscalers are doing the same thing structurally: spending more, building more, signing longer-dated power, and pushing depreciation forward into 2027–2028 earnings. The supply chain captures the revenue. The investable angle is figuring out where on that chain the leverage compounds the fastest.
Get early access to Orbit
Orbit is Luna3.ai’s AI-augmented research engine. 12 algorithmic signals + a gradient-boosted ML model + an agentic LLM that reads each top pick’s filings and writes a daily thesis with conviction score and catalyst proximity. Three regimes, three playbooks — growth in expansion, defensives in late-cycle, recovery plays at panic bottoms. The 3 in Luna3.ai.
No spam. Unsubscribe any time.
No comments yet. Be the first to share your thoughts!