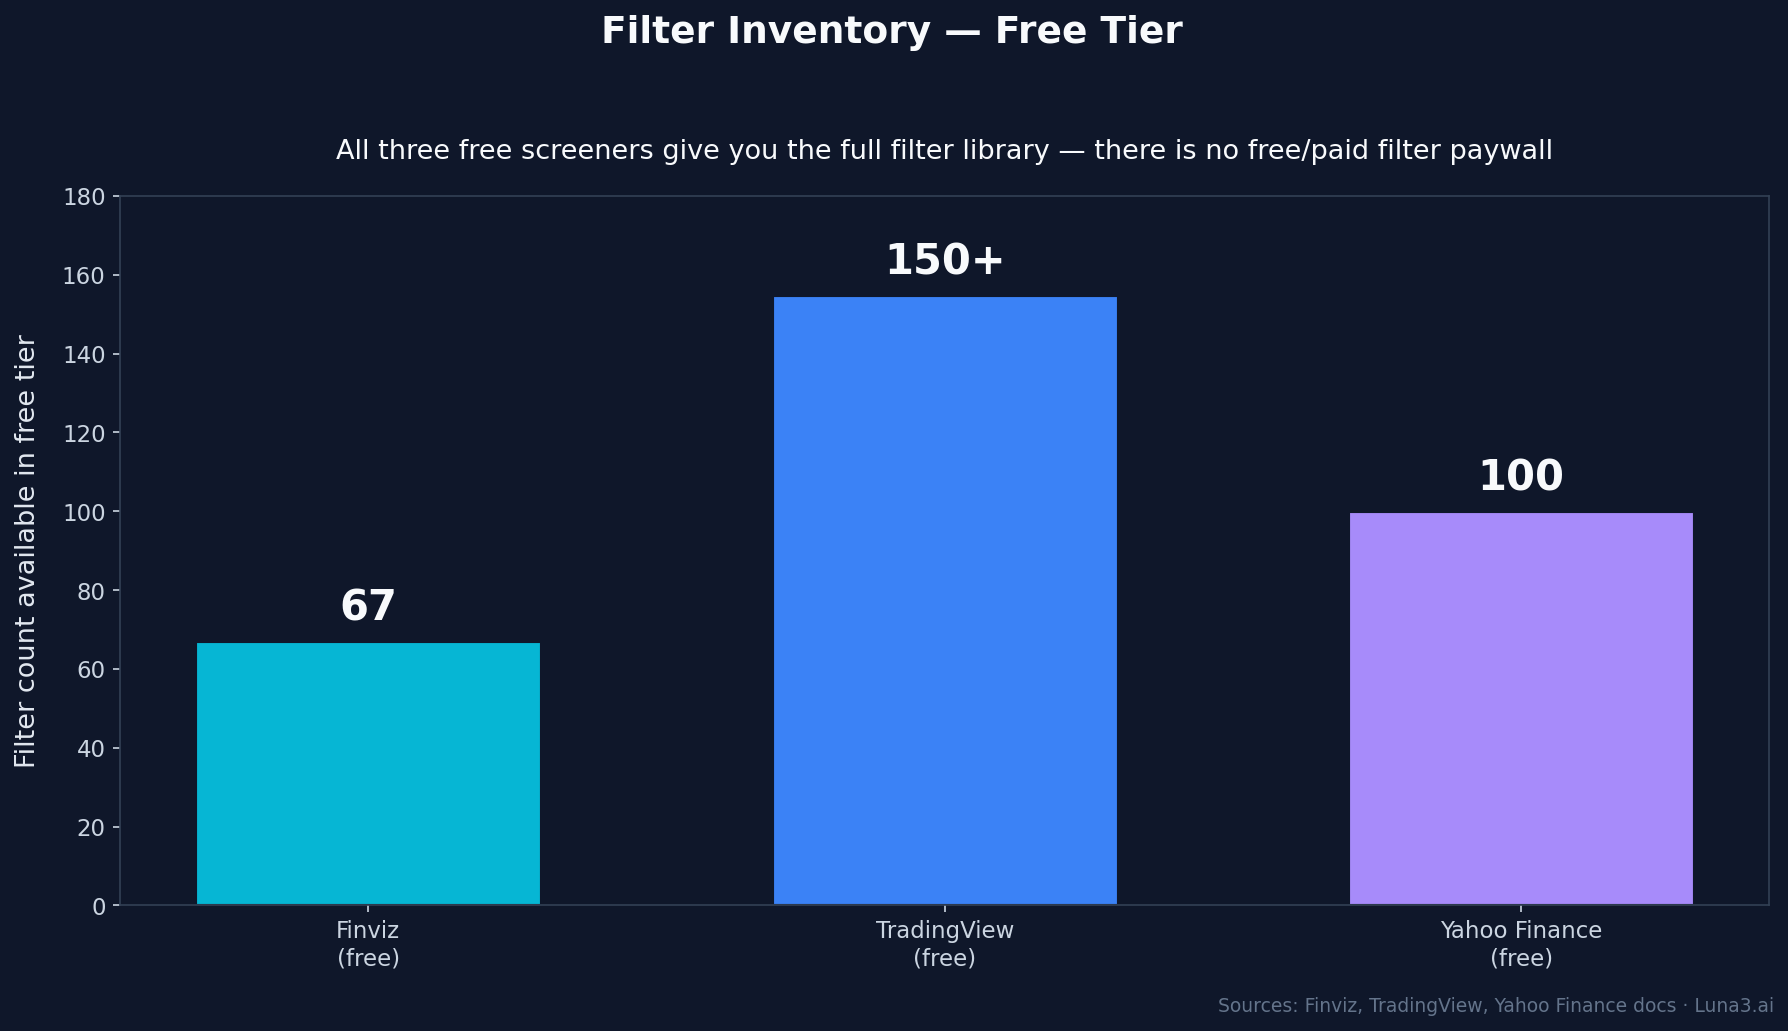
- Three free stock screeners cover roughly 98% of retail use cases: Finviz (67 filters, best for hybrid fundamental + technical screens), TradingView (150+ filters, best for charting-first workflows), Yahoo Finance (100+ filters, best for beginners with pre-built templates).
- The cheapest meaningful upgrade is TradingView Essential at $12.95/mo (real-time screening + more saved screens). Finviz Elite at $39.50/mo gets you backtesting and CSV export. Skip TradingView Plus, Premium, and Ultimate unless you need their chart-power features.
- If you're not sure where to start: pick Finviz. It's the densest free filter set on the public internet, screen results land in under a second, and the insider-trading filter is rare in free tools.
The best free stock screener for you depends on what you’re actually trying to do. Most reviews give you a feature checklist; we gave Finviz, TradingView, and Yahoo Finance the same five screens — value, momentum breakout, dividend, earnings beat, biotech catalyst — and timed each one. The verdict is cleaner than the feature lists suggest, and the price you pay for the wrong choice is hours of friction across every screen you’ll ever run.
Three free tools cover roughly 98% of retail screening use cases. Each has a different “best for.” None of the others (Stock Analysis, StockRover free tier, Webull’s screener) crack the top three on their own merits — they’re either thinner or slower.
Best Free Stock Screener: The Verdict, Up Front
Three winners depending on what you’re doing:
- Finviz wins for retail traders combining fundamental + technical filters in one query — best filter density in any free tool, and screens complete in under a second.
- TradingView wins for anyone whose workflow is screen → chart → indicators. The integration is the moat; every screener result clicks straight into a full TradingView chart.
- Yahoo Finance wins for absolute beginners — zero learning curve thanks to pre-built screen templates, but a lower ceiling than Finviz once you’ve outgrown the basics.
If you’re not sure where to start: Finviz. It’s the densest free filter set on the public internet and the screens land instantly.
The Comparison at a Glance
| Feature | Finviz (free) | TradingView (free) | Yahoo Finance (free) |
|---|---|---|---|
| Total filter count | 67 | 150+ | 100+ |
| Free filter count | 67 (all of them) | 150+ (all of them) | 100+ (all of them) |
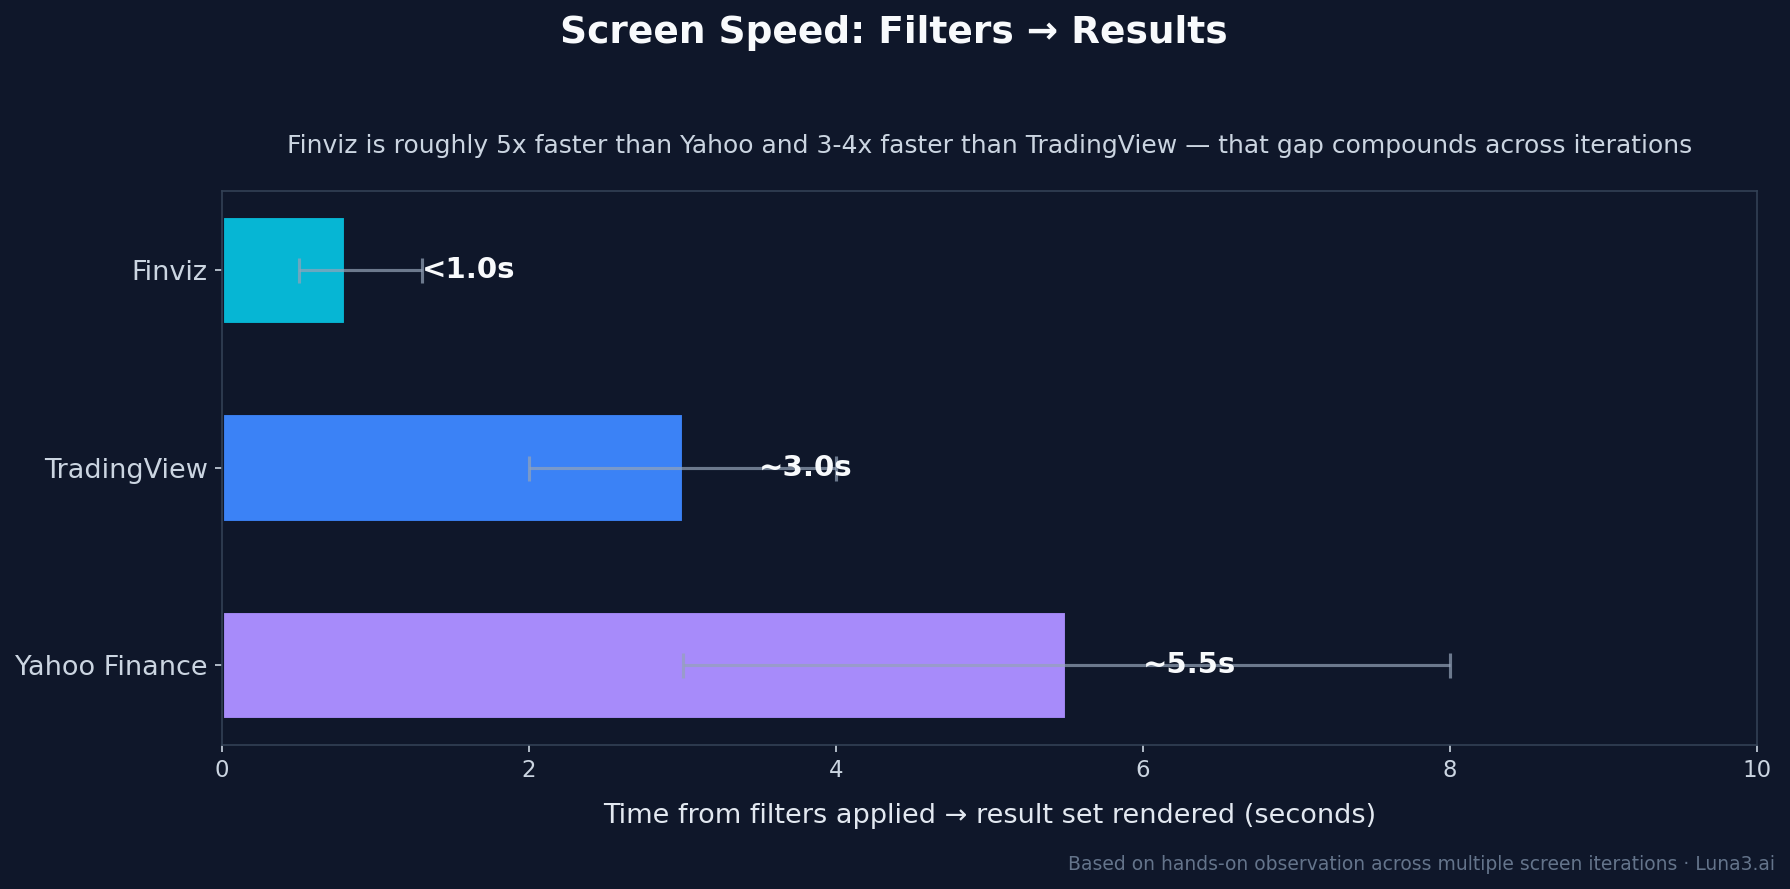
| Speed (screen → results) | <1s | 2–4s | 3–8s |
| Charting integration | Basic | Excellent | Basic |
| Data freshness on free | 15–20 min delay | End-of-day only | 15–20 min delay |
| CSV export (free) | No (Elite only) | No (paid only) | Limited (portfolios + basic historical) |
| Insider/SEC filters | Yes | No | No |
| Options screening | No | No | No |
| Mobile experience | Poor | Excellent | Good |
| Cheapest paid tier | Elite $39.50/mo | Essential $12.95/mo | Gold (historical CSV) |
Finviz: Best for Hybrid Filter Density
Finviz looks like a Bloomberg terminal that escaped to the public internet around 2003 and never updated its visual design. That is a feature. Everything is visible at once — filter panels at the top, results table beneath, all on one scrollable page. No clicking through tabs, no progressive disclosure, no “we’ve redesigned the UI” notifications.
What Finviz does better than anything else free:
- 67 filters across three tabs (Descriptive, Fundamental, Technical) — plus an “All” view that shows every filter on a single page. No email gate to use the screener itself; only the watchlist save feature requires an account.
- Filter combinations are AND logic — every filter narrows the result set. Most retail strategies need exactly this: P/E < 15 AND market cap > $2B AND RSI between 50 and 70.
- Screens complete in under a second on a US-based connection. Compare to Yahoo’s 3–8 seconds — that gap compounds when you’re iterating on a screen 20 times in a session.
- Insider trading filter and SEC-filings filter — rare in free tools. The insider filter alone is a feature most paid screeners charge for.
What’s missing in free:
- Backtesting — only available on Finviz Elite ($39.50/mo)
- CSV export of result sets — Elite only
- Real-time data — free tier lags 15–20 minutes depending on exchange
- Mobile experience — the desktop UI doesn’t compress well, and there’s no proper mobile app. If you screen from your phone, Finviz is not the answer.
- Options screening — Finviz does not screen options at all. If you need to filter by IV rank or option volume, look elsewhere (Barchart’s free tier covers this).
When to pick Finviz: any time you’re combining fundamental + technical screens, which is the most common retail use case. Especially good for catalyst trading and value-then-chart workflows.
TradingView: Best for Charting-First Workflows
TradingView’s screener is technically a secondary product — the company’s edge is charts. But that’s precisely why its screener wins for one specific use case: every screener result clicks directly into TradingView’s full charting engine, with your saved indicators, drawings, and layouts already applied. Nothing else free does this.
What TradingView does that nothing else does:
- Click any result → opens directly in the chart, with whatever indicators and layouts you’ve saved.
- 150+ filters available in the free tier — all of them, including technical indicators like Bollinger band touches, RSI divergence, and chart-pattern detection. Most reviews imply a free-vs-paid filter split; there isn’t one.
- Save screens AND chart layouts as a unified setup. That setup is your edge codified.
- Mobile screener is genuinely usable. Finviz’s isn’t. Yahoo’s barely is.
What’s missing in the free tier:
- Real-time data inside the screener — free tier uses end-of-day data. For intraday screening you need a paid plan.
- Saved screen count is capped — free tier allows a small number; paid tiers raise the limit.
- Price-alert count is capped on free.
- No insider trading data, even at the top paid tier.
- Fundamental filter depth is thinner than Finviz. If your strategy is fundamental-heavy, this is the constraint.
2026 paid tier pricing (annual billing): Essential $12.95/mo, Plus $29.95/mo, Premium $59.95/mo, Ultimate $199.95/mo. TradingView restructured its tiers in April 2026 and increased prices across the board. The cheapest tier ($12.95) is the upgrade most retail screeners actually need — real-time data, more saved screens, more alerts. The higher tiers are about charting power (more charts per tab, more indicators per chart, more historical bars), not screening.
When to pick TradingView: any time the chart is where your decision happens. If you’re a chartist who needs the screen as a pre-filter and the chart as the decision, TradingView wins on workflow integration alone.
Yahoo Finance: Best for Absolute Beginners
Yahoo Finance’s screener is the one most retail investors actually start with — because Yahoo Finance is the default destination for “look up a stock price.” That ecosystem integration is the moat. The screener itself is functional, beginner-friendly, and clearly the slowest of the three.
What Yahoo Finance does that the others can’t:
- Pre-built screen templates — “Top Gainers,” “Undervalued Growth Stocks,” “High Dividend Yields,” “Most Active Penny Stocks,” small-cap and short-interest screens. Zero learning curve to start; you click a template and the result set appears.
- Limited free CSV export — portfolios and basic historical data download natively. Full historical data CSV requires a Gold subscription, but for most retail purposes the free export is enough.
- Tight integration with the rest of the Yahoo Finance ecosystem — news, earnings calendars, analyst estimates — all one click from the screener.
- Mobile UI works without modification. Yahoo Finance is genuinely usable on a phone; Finviz isn’t.
What’s missing:
- 100+ filters available, but the strategy-expressibility ceiling is lower than Finviz. Fewer technical patterns. No insider data. No options.
- Screen results take 3–8 seconds vs Finviz’s sub-second. That gap compounds across a session.
- UI is dated and ad-supported. Filter combinations occasionally return inconsistent counts on refresh — a quirk you learn to ignore but doesn’t inspire trust.
- Pre-built templates trap you into their logic. Once you outgrow the templates, you’re either rebuilding from scratch or moving to Finviz.
When to pick Yahoo Finance: you’re new to screening and need the pre-built templates as training wheels. Graduate to Finviz within 30 days.
Five Screens Worth Running — And Which Tool Handles Each
Most reviews compare features. We picked five screens that span retail strategies (value, momentum, income, fundamentals-driven, catalyst-driven) and asked: which tool has the filter inventory to express each one cleanly?
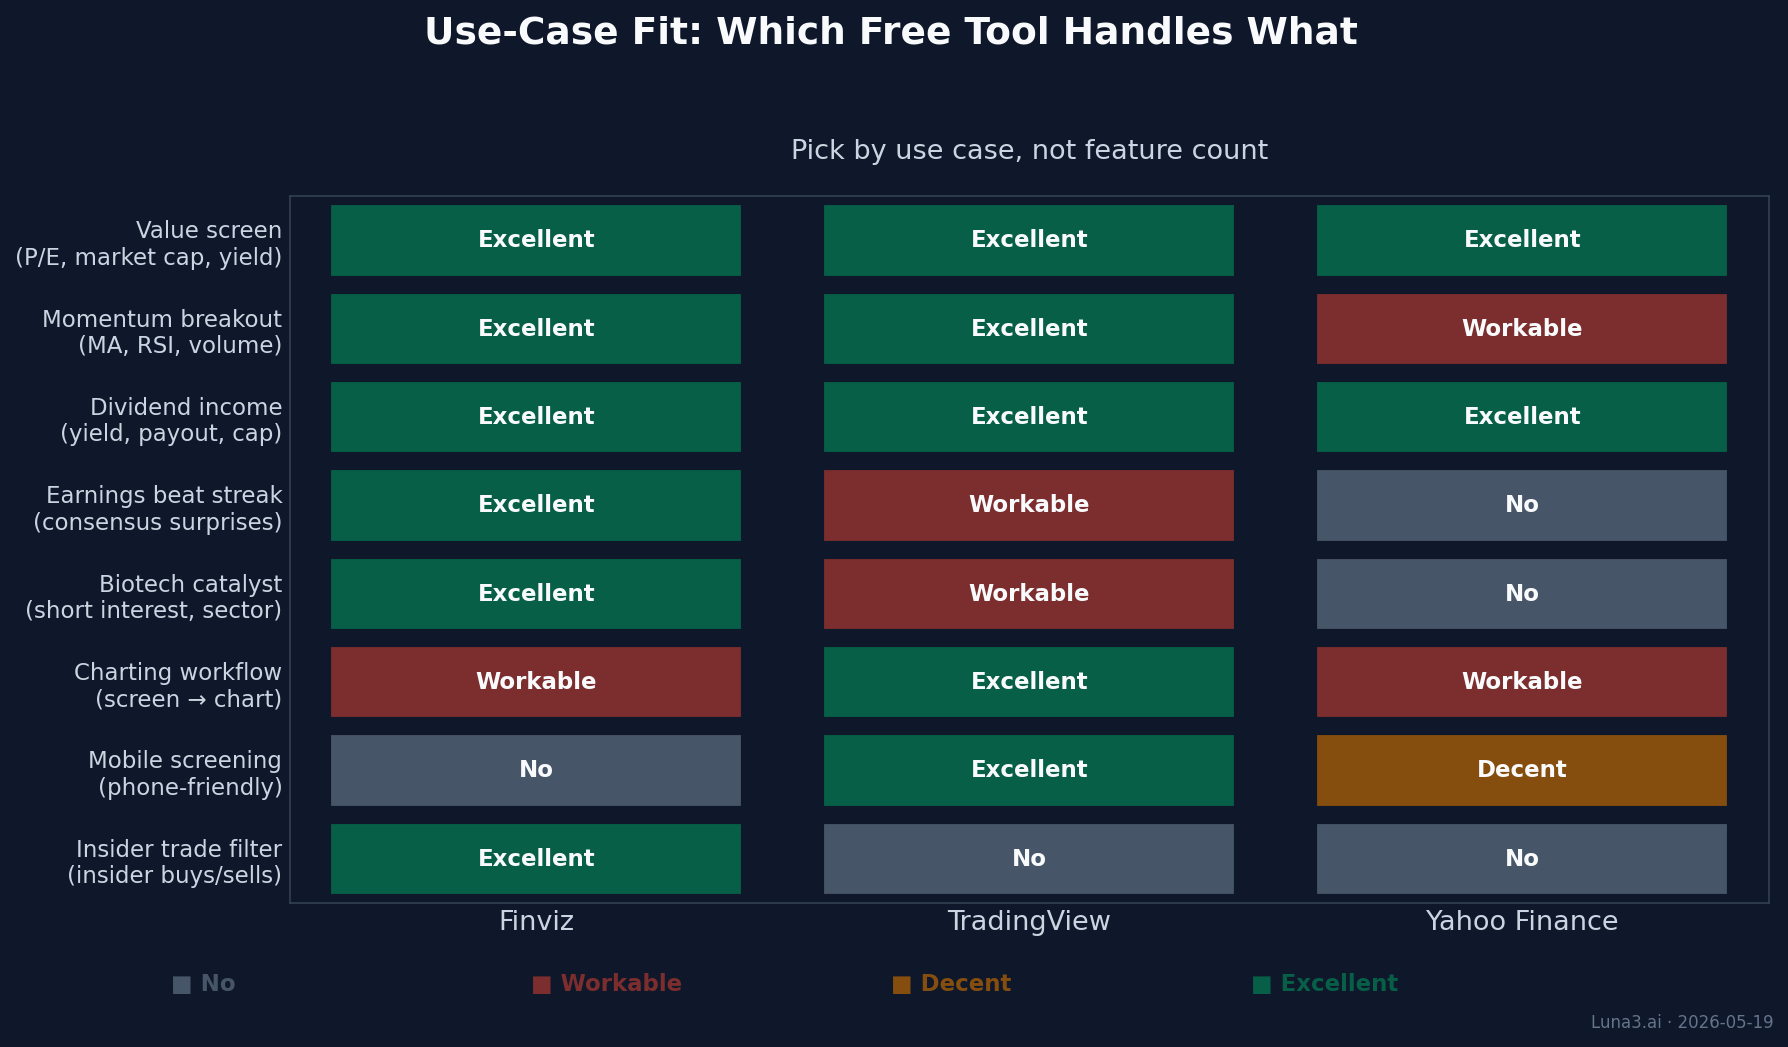
- Value screen — P/E < 15, market cap > $2B, dividend yield > 2%, US-listed. All three tools have these four filters in the free tier. The basic value screen is the screen where the tool barely matters.
- Momentum breakout — price above 50-day MA above 200-day MA, RSI between 50 and 70, volume > 1M. Finviz and TradingView both express this cleanly. Yahoo’s technical-indicator coverage is shallower; you can approximate with price-change filters but the RSI band specifically is not as granular.
- Dividend income — yield > 4%, payout ratio < 75%, market cap > $5B. All three handle it. Yahoo’s built-in “High Dividend Yields” template is the fastest path if you’re not customising.
- Earnings beat streak — beat consensus EPS each of the last four quarters. Finviz has an “EPS Surprise” filter that handles this in one line. TradingView requires combining several fundamentals filters; possible but clunky. Yahoo doesn’t expose a multi-quarter beat filter.
- Biotech catalyst — sector = biotech, market cap $500M–$5B, short interest > 15%. Finviz is the only one of the three with a free short-interest filter. TradingView’s short-interest data is paid-tier; Yahoo doesn’t expose it.
Of the five screens, the dividend income and basic value screens are the ones where the tool barely matters. The other three — momentum, earnings beat streak, biotech catalyst — push you toward Finviz because it’s the only free tool with the filter depth to express them in one query. That’s the practical cost of Yahoo’s 100+ filters vs Finviz’s 67: Yahoo’s filter count looks higher, but the filters are individually shallower.
The Verdict Recap
Pick by use case, not feature count:
- Fundamental + technical hybrid screens → Finviz (best filter density, fastest, insider data)
- Charting-first workflow → TradingView (best chart integration, mobile-usable)
- Just learning to screen → Yahoo Finance (best onboarding via pre-built templates)
If you can afford one paid upgrade: the cheapest meaningful tier on each is Finviz Elite at $39.50/mo (backtesting + real-time + CSV export) or TradingView Essential at $12.95/mo annual (real-time screening + more saved screens + more alerts). The Finviz upgrade buys more if you’re a screener; the TradingView Essential tier buys more if you already live in their charts. Skip TradingView’s higher tiers (Plus $29.95, Premium $59.95, Ultimate $199.95) unless you specifically need their chart-power features — more charts per tab, more indicators per chart, more historical bars.
The honest answer for most retail investors: start with Finviz free, learn to combine 4–6 filters into a repeatable screen, then evaluate whether you need real-time data ($39.50) or chart integration ($12.95) more.
What to Read Next
- TradingView vs StockCharts: Best Charting Platform 2026 — the charting platform showdown that pairs with this screener comparison. If TradingView wins your screener pick, this is the next decision.
- Webull vs Robinhood: Best Active Investing App 2026 — once you’ve screened, where do you actually place the trade?
- VOO vs VTI: Which Vanguard ETF Actually Makes More Sense? — the alternative to stock-picking: sometimes the right answer to “what stock?” is “no stock, an index ETF.” Worth knowing the comparison.
Get early access to Orbit
Orbit is Luna3.ai’s AI-augmented research engine. 12 algorithmic signals + a gradient-boosted ML model + an agentic LLM that reads each top pick’s filings and writes a daily thesis with conviction score and catalyst proximity. Three regimes, three playbooks — growth in expansion, defensives in late-cycle, recovery plays at panic bottoms. The 3 in Luna3.ai.
No spam. Unsubscribe any time.
No comments yet. Be the first to share your thoughts!