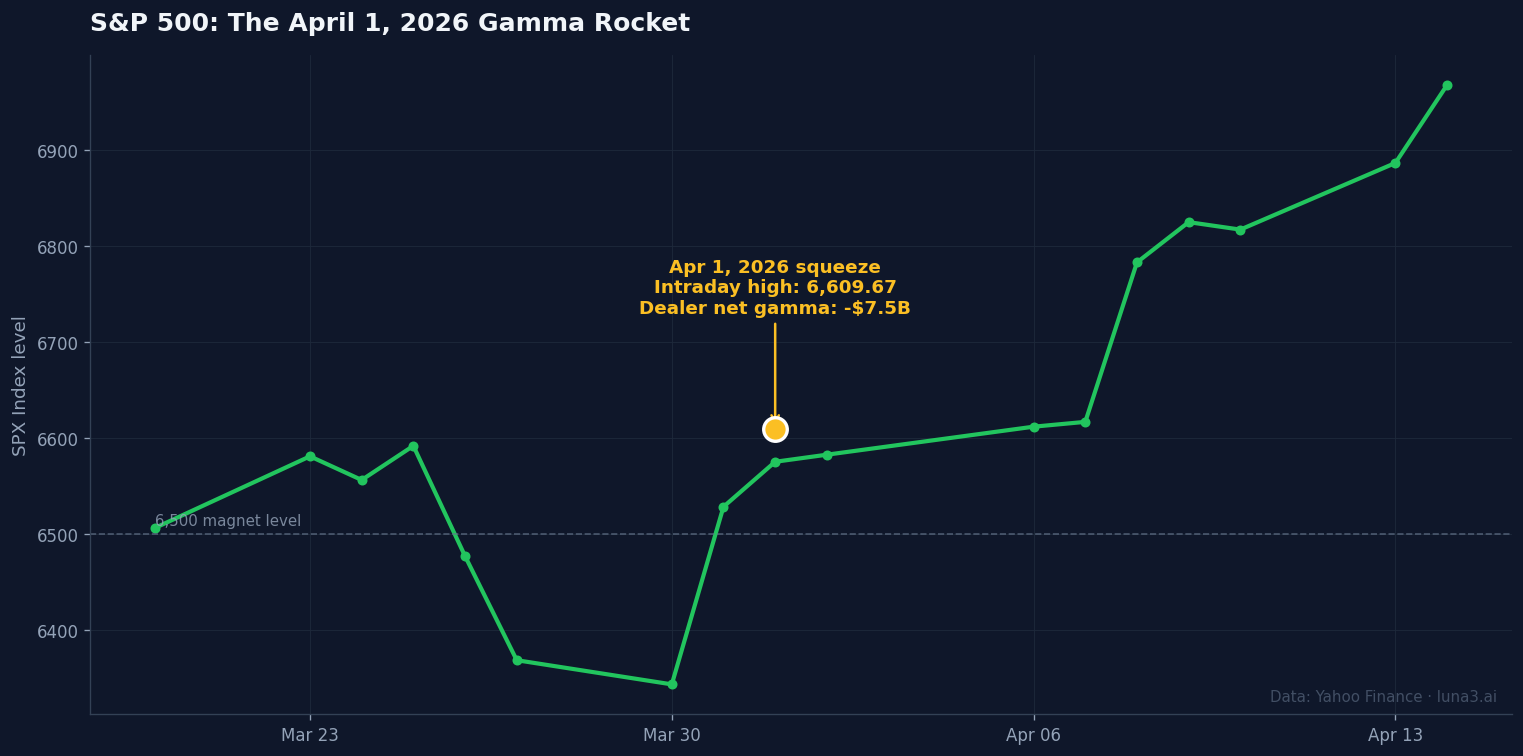
- The April 1, 2026 S&P session — a ~100-point intraday move into a 6,609 high — was a textbook gamma squeeze, driven by roughly -$7.5B in dealer net gamma sitting against a record $2.6T notional call open interest.
- Gamma squeeze mechanics live in the delta ladder: each $1 of upside forces dealers to buy more shares to stay neutral, which lifts price closer to the next delta threshold, which forces a bigger hedge.
- Gamma exposure (GEX) is the systematic read on the setup — negative GEX means dealers amplify; positive GEX means dealers dampen. The free CBOE daily options data is enough to compute it.
On April 1, 2026, the S&P 500 punched through 6,500 to an intraday high of 6,609.67 — a roughly 100-point one-day surge — while dealers at Goldman Sachs, Morgan Stanley, and the rest of the street carried something near minus $7.5 billion in net gamma. The market was overflowing with calls: $2.6 trillion in notional call open interest, a record. Most retail traders watched the tape rip and called it momentum. Almost nobody named the actual driver. That driver is gamma squeeze mechanics — the chain of forced dealer buys that turns a localised options imbalance into a self-reinforcing rally.
We’ve covered how institutional order flow actually moves price at the print level. The options layer is the more interesting feedback loop. When dealers sell calls, they have to hedge those positions. As price climbs, the size of that hedge grows — and grows non-linearly. The result is a market that runs on its own exhaust for a session or two, then reverses just as mechanically when the fuel burns off.
Why this matters now
Two structural shifts have made gamma the dominant short-horizon driver of US equity tape: the explosion of zero-day-to-expiry (0DTE) options, which now account for more than half of SPX options volume, and the multi-trillion-dollar growth of call-overwrite and call-buying flows out of retail platforms and institutional volatility funds. Both shorten the hedging timeline. A dealer who is short a 60-day call has 60 days to rebalance gently. A dealer who is short a 0DTE call has hours.
The single-stock version is louder than the index version. NVDA is the canonical retail case study: heavy call open interest around round-number strikes ($150, $200), tight gamma walls, and a chain that turns over weekly. When the stock approaches a high-OI strike with dealers net short gamma, hedging amplifies the move; when it pulls back through, hedging amplifies the selloff. That’s why NVDA rallies and selloffs in 2025 have been unusually clean and unusually fast relative to a typical mega-cap.
Misread one way, this looks like a short squeeze. It isn’t. A short squeeze needs high short interest and a tight borrow. A gamma squeeze can fire on any liquid optionable name with no short interest at all — the buying isn’t shorts covering, it’s dealers hedging. The two get confused constantly because they produce similar-looking charts. The mechanism is completely different, and the signals you’d watch are completely different.
How gamma squeeze mechanics actually work
Two of the option Greeks do all the work here. Delta is the option’s sensitivity to a $1 change in the underlying — a call with 0.50 delta moves $0.50 for every $1 move in the stock. Gamma is the rate of change of delta. As price approaches the strike, delta accelerates; gamma is what makes that acceleration happen. The CBOE Options Institute glossary has the canonical definitions if you want a primer.
Here’s the setup that creates a squeeze. A market maker sells 100 short-dated calls at the $105 strike to a customer who wants upside. To stay delta-neutral, the dealer immediately buys some shares — at-spot delta of 0.20, that means roughly 20 shares per 100 calls. Easy. Now price drifts up to $102. Delta on those calls is now 0.30. The dealer has to own 30 shares, not 20. So they buy 10 more. The buy itself nudges price up a little further.
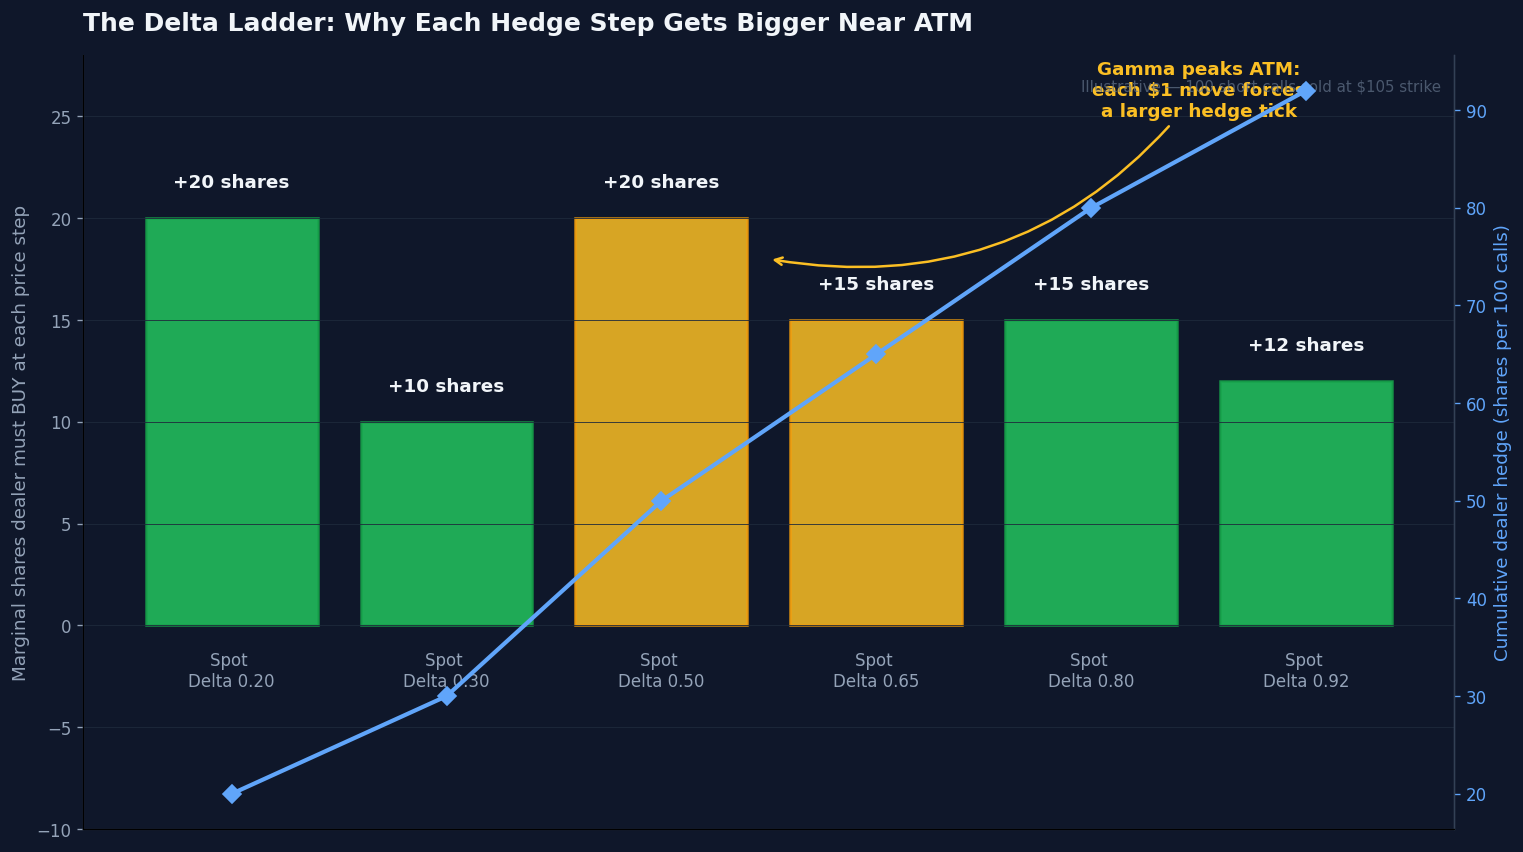
Step through it. Price ticks to $104. Delta climbs to 0.50. Dealer must own 50 shares — buys 20 more. Price ticks to $106. Delta jumps to 0.65, then 0.80 as it punches through ATM. The dealer is now buying 15, then another 15. At $108, with delta at 0.80, the cumulative position is 80 shares per 100 calls. At $110, with delta near 0.92, it’s basically 92 shares — almost fully covered. The ladder rises faster in the middle, slower at the extremes. That middle bulge is gamma. It’s what makes the loop self-reinforcing.
Now scale this from one dealer’s 100-call position to a market-wide imbalance. When billions of dollars in call open interest concentrate inside a narrow strike band — a “magnet strike” — the cumulative dealer hedging at that band becomes huge. Cross the magnet strike and you trigger a wave of dealer buys all at the same delta threshold. That’s not algorithmic momentum or news flow. That’s plumbing.
The time dimension makes it worse. Gamma is not constant. It’s highest for at-the-money options near expiration. A 30-day call with delta 0.50 has modest gamma — each $1 of underlying movement nudges delta by maybe 0.02. A same-day-expiry call with delta 0.50 can have gamma five to ten times larger. Each $1 move forces dealers to rebalance much harder, and they have to do it in minutes instead of days. This is why 0DTE Fridays produce the loudest gamma episodes, and why a quiet Tuesday rarely turns into a squeeze even with comparable open interest.
April 1, 2026 was the macro version of all of this. The S&P had spent Q1 falling 7.1% on a growth scare. Institutions hedged heavily. Retail and volatility funds bought a wall of out-of-the-money calls betting on a Q2 recovery. Geopolitical de-escalation rumours plus an AI-earnings catalyst flipped sentiment in a session. Dealers — who were short all those calls — had to chase. The 6,500 magnet flipped from being a ceiling into the launching pad.
How an algorithm reads this
The systematic read on gamma squeeze mechanics is a metric called gamma exposure, or GEX. It rolls up the entire options chain into one number per name. Conceptually:
GEX = Σ (open interest × gamma × contract multiplier × spot²) — summed across every strike and expiration, with calls counted positive and puts counted negative. The output has units of dollars-of-share-buying-required-per-1%-move. Sign matters as much as magnitude. Negative GEX means dealers are net short gamma — when price rises they buy, when price falls they sell, amplifying both directions. Positive GEX means dealers are net long gamma — they fade moves in both directions, suppressing realised vol.
The April 1, 2026 SPX setup read as roughly -$7.5 billion in net dealer gamma. That figure is the language for “a 1% move forces $7.5B of one-directional dealer buying or selling.” A systematic strategy looking at that print on March 30 or 31 would have flagged the setup as high-probability for accelerated upside if any positive catalyst hit. None of the math required predicting the geopolitical headlines or earnings beats — only recognising that the kindling was stacked.
The signal logic a desk would actually code looks something like this: when (a) 30-day realised vol is below 20-day implied vol — meaning the options market is paid up for moves the underlying isn’t yet delivering — AND (b) GEX is strongly negative — meaning dealers will amplify any direction — AND (c) price is within 1% of a heavily-stacked call strike — the magnet — flag elevated probability of an accelerating move at the next ATM print. This is not a prediction engine. It’s a filter that says: if anything ignites here, the response will be outsized.
The academic backbone for this approach is well-established. Muravyev’s 2016 study in the Journal of Finance showed that dealer inventory risk has a first-order effect on option prices — that options order imbalances attributable to inventory have roughly five times the price impact previously estimated. That’s the formal evidence that hedging flow isn’t a sideshow. It’s the main event.
Signals to watch and where to get the data
You don’t need a paid GEX vendor to track this. The raw inputs are public.
- CBOE daily market statistics download — free, official, open interest by strike for every listed product. The full options chain is yours to crunch.
- Magnet strike identification — find the strike with the highest aggregate call open interest within ±5% of spot. That’s your gravitational centre. If it’s above spot in a negative-GEX regime, expect upward magnet behaviour.
- Gamma sign-flip strikes — the level where the dealer GEX position changes sign. In negative-GEX regimes, that level often acts as a structural pivot: above it dealers buy strength, below it they sell weakness.
- Expiry calendar — squeeze risk spikes on 0DTE Fridays, weekly expirations, and monthly OPEX. A negative-GEX setup on a Monday rarely fires the way the same setup fires on a Friday morning.
- Vol surface shape — front-end skew flattening into the squeeze window is a tell. Dealers’ hedge buffer is shrinking; small price moves now force big hedge adjustments.
Pair this with positioning data from a different angle: the COT report read like an algorithm does shows how futures positioning shapes the floor for any options-driven squeeze. The two layers compound. A negative-GEX print on SPX with stretched commercial short positioning in S&P futures is a louder setup than either signal alone.
Where retail gets this wrong
Four mistakes show up over and over.
Confusing gamma squeezes with short squeezes. The mechanics, the signals, and the unwind are different. A gamma squeeze fires when call open interest concentrates and dealers chase. A short squeeze fires when shorts get forced out. Both look like vertical green candles; the data trail behind them looks nothing alike.
Buying calls into the squeeze. By the time the squeeze is obvious on the tape, dealers may already be nearly fully delta-hedged at the new spot. Implied vol has rerated upward. Buying calls at peak gamma locks in maximum theta exposure at exactly the worst entry. The squeeze can keep running and the call buyer can still bleed if vol comes back in after the print.
Treating a gamma “wall” as a ceiling in every regime. Walls only act as ceilings in positive-GEX regimes, where dealers fade approaches to high-OI strikes. In negative-GEX regimes, the same strike acts as a magnet. Reading the sign before reading the level is non-negotiable.
Ignoring expiry. A squeeze that stalls into Friday afternoon resets completely after expiration. The call chain rolls off. The dealer hedge gets unwound. The structural fuel disappears overnight. Plenty of “the squeeze is just pausing” Monday-morning postmortems are actually “the squeeze ended Friday at 4:00 PM and nobody updated their priors.”
Bottom line
Gamma squeeze mechanics aren’t exotic — they’re the predictable consequence of dealer hedging math hitting a concentrated options imbalance. The mechanism is delta ladder, magnet strike, expiry clock. The systematic read is GEX sign and magnitude. The data sources are public. The April 1, 2026 SPX session was the most expensive recent reminder that the options chain isn’t a sidecar to equity tape — it’s the engine room.
Get early access to Orbit
Orbit is Luna3.ai’s AI-augmented research engine. 12 algorithmic signals + a gradient-boosted ML model + an agentic LLM that reads each top pick’s filings and writes a daily thesis with conviction score and catalyst proximity. Three regimes, three playbooks — growth in expansion, defensives in late-cycle, recovery plays at panic bottoms. The 3 in Luna3.ai.
No spam. Unsubscribe any time.
No comments yet. Be the first to share your thoughts!