Welcome to the Market Pulse Digest for the week of May 11-15, 2026. The S&P 500 just notched its seventh straight weekly gain — the longest streak since the nine-week run that ended in December 2023. On paper the rally is intact. Look underneath, and the trade has already cracked. April CPI ran at its highest annual pace since May 2023. PPI posted its biggest monthly jump since March 2022. Brent crude surged through $109 as the Strait of Hormuz stayed roughly 90% shut in the third month of an active US-Israel-Iran air war. The 10-year Treasury yield closed Friday at a one-year high of 4.59%. And Jerome Powell's eight-year term as Fed Chair ended Friday, handing the gavel to Kevin Warsh after the most divisive Fed Chair confirmation vote in history. The streak survived by 13 basis points. The trade underneath did not.
- 7th straight weekly gain for the S&P 500 (+0.13%) — longest streak since the 9-week run that ended December 2023. Survived by basis points.
- Friday's -1.24% S&P session was the worst single day in over a month; Russell 2000 fell -2.44% on the day, -2.37% on the week.
- April CPI +3.8% y/y (highest since May 2023); PPI +1.4% m/m (largest since March 2022, with 40%+ of the gain driven by a 15.6% gasoline surge).
- Brent crude +7.87% on the week to $109.26 as the Strait of Hormuz stayed roughly 90% shut in the third month of the US-Israel-Iran air war.
- 10-year yield closed at 4.59% (1-year high), pricing both hot inflation and Kevin Warsh's confirmed hawkish stance as the new Fed Chair.
The week by the numbers
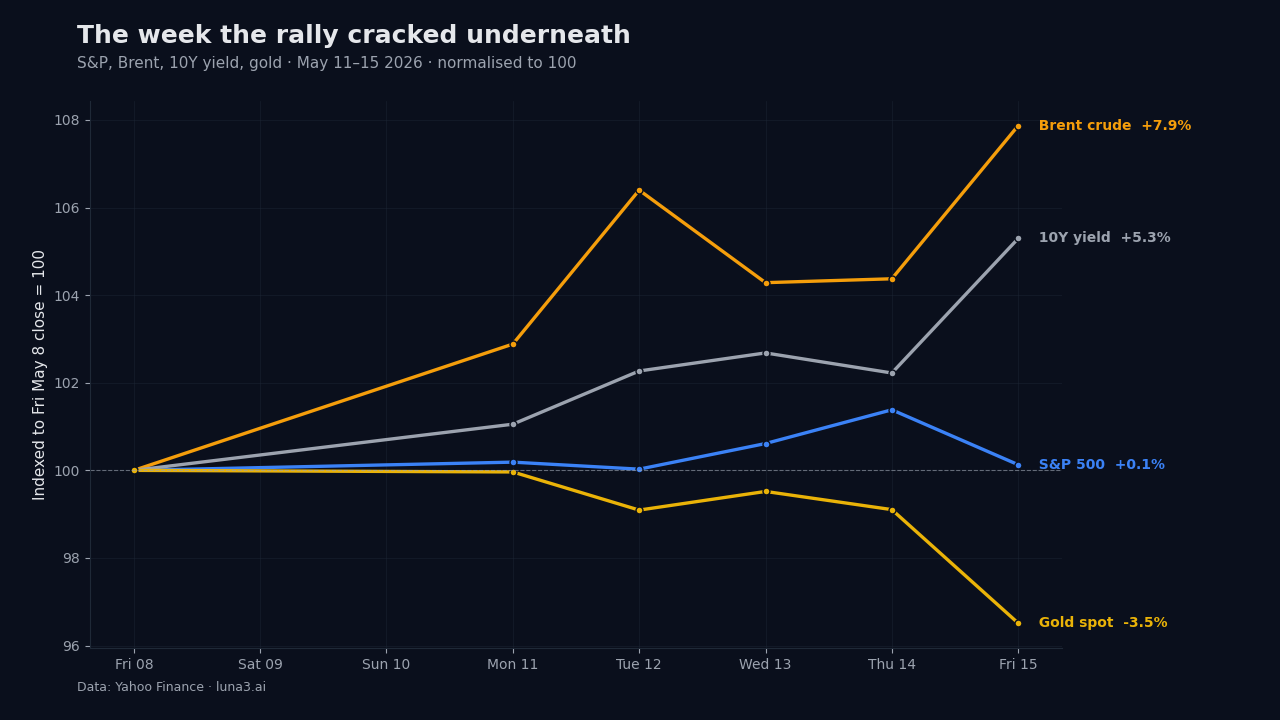
A streak that survives by 13 basis points isn't the same as a streak that thrives. Here is what the close-to-close tape looked like for the trading week ending Friday May 15.
| Asset | Friday close | Week % | Friday % |
|---|---|---|---|
| S&P 500 (^GSPC) | 7,408.50 | +0.13% | -1.24% |
| Nasdaq Composite (^IXIC) | 26,225.14 | -0.08% | -1.54% |
| Dow Jones (^DJI) | 49,526.17 | -0.17% | -1.07% |
| Russell 2000 (^RUT) | 2,793.30 | -2.37% | -2.44% |
| 10Y Treasury (^TNX) | 4.59% | +23 bp | — |
| 30Y Treasury (^TYX) | 5.13% | +18 bp | — |
| Brent crude (BZ=F) | $109.26 | +7.87% | — |
| WTI crude (CL=F) | $105.42 | +10.48% | — |
| Gold spot (GC=F) | $4,555.80 | -3.49% | — |
| US Dollar Index (DXY) | 99.27 | +1.46% | — |
| Bitcoin (BTC-USD) | $78,095 | -4.45% | — |
Read the table top-down and the story is already there. The headline indices are flat to slightly up. Small caps cracked. Yields broke higher across the curve. Crude is in a sustained move. The dollar firmed. Gold — usually the inflation hedge of last resort — sold off hard because real yields rose faster than inflation expectations. Bitcoin, often correlated to high-beta growth, gave back ground too. This is not the cross-asset signature of a market that thinks the soft-landing thesis is still intact.
Market Pulse Digest read: four forces broke the rally on Friday
Four discrete data points hit between Monday and Friday, and they need to be read together. None of them on its own would be enough to crack a 7-week rally. All four together did.
1. CPI surprise (released Monday May 12)
April CPI came in at +0.6% month-on-month seasonally adjusted, +3.8% year-on-year not seasonally adjusted. That 3.8% headline is the highest annual pace since May 2023. Core (ex food and energy) ran +0.4% m/m, +2.8% y/y — sticky but stable. The interpretation that matters: this is inflation re-acceleration, not inflation stickiness. Stickiness lets the Fed wait. Re-acceleration forces a reaction function. Markets understood the distinction, and yields started climbing the same morning the print landed.
2. PPI shock (released Wednesday May 13)
The April PPI for final demand jumped +1.4% month-on-month — the largest monthly increase since March 2022 (+1.7%). The composition matters: more than 40% of the gain traced to a single line item — a 15.6% surge in gasoline prices. This is an energy-shock PPI, not a core-services PPI. That distinction is double-edged. Energy shocks fade if oil pulls back. But they also feed into headline CPI with a one-to-three-month lag, which means the April PPI print is already telling you what the May, June and July CPI prints are likely to show. Pipeline inflation has been the most reliable leading indicator of CPI surprises for two years now. The pipeline just turned.
3. Oil plus an active war
Brent finished the week up +7.87% at $109.26. WTI ran up +10.48% to $105.42. Frame this correctly: it is not a localised shipping dispute. The Strait of Hormuz has been roughly 90% shut since February 28, the day the US and Israel launched air war operations against Iran. Iran has responded by blocking the Strait, through which a major share of seaborne oil normally transits. The EIA now assumes flows stay disrupted through at least late May. Goldman has flagged that another month of closure means Brent stays above $100 through the rest of 2026. This is the inflation feedback loop in real time: war → oil → gasoline → PPI → CPI → yields → equity multiples. Three of the five links fired this week.
4. Powell hands off to Warsh, Trump-Xi summit ends without breakthroughs
Friday May 15 was the proximate trigger day. Two events landed at once. First, Jerome Powell's eight-year term as Fed Chair officially ended; the Federal Reserve Board named Powell chair pro tempore until Kevin Warsh is sworn in. Warsh was confirmed by the Senate on May 13 in a 54-45 vote — the most divisive Fed Chair confirmation in history; only Sen. John Fetterman crossed the aisle. Powell, unusually, stays on as a governor with a term running to 2028, the first outgoing Fed chair to remain on the Board since Marriner Eccles in 1948. Markets read this as a deliberate signal: institutional continuity inside a chair transition that is widely viewed as more hawkish under Warsh. Friday's yield spike was specifically priced for the Warsh reaction function — not generic transition uncertainty.
Second, the Trump-Xi summit wrapped Friday without major policy breakthroughs on trade or rare earths. Add a war-driven oil shock, a hot inflation pair, a hawkish Fed transition, and a tariff overhang with no resolution, and Friday became the kind of session where every long position becomes a one-question debate: do I want to be holding this into Monday?
Sector heatmap: where the damage concentrated
The cross-sectional read is as informative as the index level. Technology and communication services led the decline as yields jumped — the standard duration trade. Consumer discretionary sold hard on a double whammy of higher yields and energy-driven cost pressure. Industrials and transports lagged on cyclical-risk-off. Materials were mixed, with miners catching a bid against the broader commodity complex selling. Energy was the standout positive sector, but treat the gain as a tail-risk hedge that paid, not as a growth signal — energy was up because of geopolitical disruption, not because demand surprised to the upside. Defensives (staples, utilities, healthcare) held up better than cyclicals as the rotation that started Tuesday accelerated through Friday.
Single-name movers
Earnings flow was thin in a quiet pre-NVDA week. The notable tape action stayed in narrative-driven names. Bitcoin miners BITF and KEEL — covered in last week's long-form on the crypto-to-AI infrastructure conversion thesis — were mixed: KEEL held its breakout zone through Wednesday before fading with the broader tape on Friday, while BITF traded heavy from Monday after profit-takers locked in the prior week's gains. The cross-current is interesting: if the AI infra conversion thesis remains intact, these names should be relatively insulated from the macro selloff. They did not behave that way this week. Watch whether the underperformance is one-week-noise or a signal that the AI infra trade is becoming yield-sensitive.
Among large caps: mega-cap tech (the seven names that anchor the indices) carried index losses on Friday as duration repriced. Defensives in healthcare and consumer staples relatively outperformed on a flight-to-quality flow. Energy majors had their best week in months on the Brent move. Banks were a mixed bag — higher yields normally help net interest margin, but a widening credit spread and a hawkish Fed re-rating offset most of the yield-curve benefit.
What didn't move
Just as important as what moved is what stayed still. Credit spreads widened only modestly — the high-yield bond market did not crack along with equities, which means the bond market is not yet pricing recession. VIX remained subdued through Thursday before lifting on Friday; the volatility complex is not panicking, which both bulls and bears can read in their own favour. Earnings forward estimates for the S&P 500 did not revise down during the week — analysts are holding 2026 EPS forecasts intact for now. And retail buy-the-dip flow, by Friday afternoon, had already started to show in the order flow data, suggesting at least some part of the dip is being bought rather than slept on. None of these are reassurance signals on their own. Read together, they say the same thing the index level says: the rally is bent, not broken — yet.
What's next: week of May 18-22
The calendar thins out from here. Empire State manufacturing (Monday), retail sales (Tuesday), housing starts (Wednesday), jobless claims plus Philly Fed (Thursday) and existing home sales (Friday) are the macro releases of note. The earnings tape kicks off Tuesday with Home Depot pre-market, Target on Wednesday morning, then the headline event — NVIDIA on Wednesday May 20 after the close. NVDA is a single name that historically moves the SPX by 0.5-1% on print night regardless of the company's own outlook. Walmart reports Thursday May 21 pre-market. After that the calendar thins; the next big AI-adjacent print is Snowflake on May 27 (next week), which gives the market a single uninterrupted week to digest whatever NVIDIA says. Across the macro and earnings tape, NVIDIA is the one that decides whether the AI trade carries the index through the inflation re-acceleration or gets repriced alongside it.
The watch list:
- Does Friday's break extend on Monday? Continuation reads as regime change confirmed. A sharp reversion reads as "ugly Friday" one-off.
- Brent price path: any breakthrough on the Iran negotiations would crater the oil bid in hours; absence of progress keeps the premium structural.
- 10-year yield: closed Friday at 4.59%. Where do equities crack — 4.7%? 5.0%? — vs. where the tape just chops?
- The first signal from Warsh: dovish reassurance or hawkish confirmation? Markets are pricing the latter.
- Powell's posture as governor: does he publicly differ with Warsh on the rate path? The optics of an active-governor predecessor are unprecedented in the modern Fed.
- NVDA print (Wednesday): a beat-and-raise rescues the AI trade. An in-line print under macro stress means even AI is vulnerable to repricing.
Bottom line
Tactical: the rally is not officially over — the 7-week streak technically survived. But the cross-asset signature this week (yields up, oil up, gold down, small caps cracked, mega-cap tech leading declines) is not the signature of a market that thinks the soft-landing thesis is still intact. "Respect the trend" gets a much harder test on Monday than it has had in two months.
Strategic: the 2026 consensus thesis — "disinflation continues, soft landing holds, Fed cuts in H2" — just had piece one (disinflation) broken by April CPI and PPI together. Pieces two and three are not yet broken. They depend on whether the energy shock fades or persists, and whether the Warsh-led Fed reaction function is materially different from Powell's. Both questions get partially answered in the next four weeks.
Posture: this is not a sell-everything signal. It is a "lighten beta, raise quality, hold some cash" week if you have been long-and-strong since the March lows. The next clean signal is binary: a Brent move back under $100 by month-end would be a meaningful all-clear; a Brent print above $115 in the same window means the war premium is here for at least one more quarter, and so is the inflation feedback loop that goes with it. Watch the oil tape closer than the equity tape for the next two weeks. The equity tape is downstream.
No comments yet. Be the first to share your thoughts!