

- US money market funds hold a record $7.77T as of May 2026 — more than 2× the pre-2008 peak, and still climbing despite 175 bp of Fed cuts since September 2024.
- The 'cash on the sidelines waiting to buy stocks' narrative has been wrong for 24+ straight months — net flows have gone IN every week through May 2026, not out.
- The historical rotation trigger isn't equity rallies; it's MMF yields dropping 100+ bp below the 2-year Treasury and short-duration IG alternatives — and that spread hasn't inverted yet.
The cash-on-the-sidelines narrative is finance’s most reliable wrong call. Every quarter for the past two years, a strategist has appeared on TV to explain that the trillions parked in money market funds are about to rotate into equities. Every quarter, the pile has gone up. By the week ending May 20, 2026, US money market funds held $7.77 trillion — a record, bigger than the GDP of Japan, and more than double the entire industry’s pre-2008 peak. The Fed has cut 175 basis points since September 2024. The 7-day SEC yield on the top retail funds has compressed from a 2023 peak near 5.2% to about 3.6% today. None of it has reversed the flows. This piece explains what money market funds actually are, why retail keeps adding to the pile even at compressed yields, which funds reward attention, the structural risks the marketing decks omit, and the specific spread — not headline — that actually moves this money.
What money market funds actually are
A money market fund is a mutual fund that holds only short-term, high-quality debt — Treasury bills, repurchase agreements, agency notes, and (for some funds) commercial paper — and is structured to hold its share price stable at $1.00. Bruce Bent and Henry Brown launched the first money market fund — the Reserve Fund — in November 1971 as a workaround to Regulation Q, which capped the rate banks could pay on deposits at 5% while inflation pushed past that. Investors had no way to earn a real return on cash. Bent and Brown gave them one. The Federal Reserve’s own history of the industry traces every meaningful structural change back to that launch.
The SEC governs the structure under Rule 2a-7. The rules cap weighted-average maturity at 60 days, require at least 25% of assets in daily-liquid instruments, and require at least 50% in weekly-liquid instruments for government funds. Credit-quality limits apply to anything that isn’t Treasury or government-agency paper.
Retail encounters three flavors. Government MMFs hold at least 99.5% of assets in cash, Treasuries, and government repo — lowest yield, lowest credit risk, no redemption gates allowed under the rules. Prime MMFs can hold commercial paper and bank CDs alongside Treasury and agency paper — higher yield by roughly 10 to 20 basis points, with the trade-off that the board can impose discretionary redemption fees during stress. Tax-exempt or municipal MMFs hold short municipal paper, and the after-tax yield can beat government funds for high-bracket investors in high-tax states.
There’s also the sweep-versus-purchased distinction, and it matters more than most retail accounts realise. Most brokerages default uninvested cash to a bank sweep paying a low rate. Fidelity is the rare exception — its default is SPAXX, an actual money market fund. At Schwab, Vanguard direct, Merrill, and most others, the higher-yielding MMF requires an explicit purchase order. The yield gap between bank sweep and a purchased MMF runs 100 to 200 basis points depending on the broker — a small habit change with a meaningful annual payout. This is the same yield-chasing instinct that drove flows into high-yield savings accounts over the same period, just with a different wrapper.
How $7.77 trillion got here
Pre-2008, the industry was a niche cash-management tool serving institutional treasurers more than retail savers. At the September 2008 peak, total MMF assets stood at roughly $3.4 trillion, with institutional funds accounting for 63% of that. Then Lehman Brothers filed for bankruptcy on September 15, and the next day the Reserve Primary Fund — the $62.6 billion direct descendant of the Reserve Fund Bent had launched 37 years earlier — wrote down its $785 million in Lehman commercial paper, fell to a $0.97 NAV, and “broke the buck.” The Treasury announced a temporary guarantee program three days later to stop the run. The reforms that followed reshaped the industry.
The decade after was quiet. ZIRP held yields near zero, and the industry plodded sideways. The pre-COVID baseline in February 2020 was about $3.6 trillion, only modestly above the 2008 peak. COVID changed everything: cash hoarding pushed assets through $4 trillion in March 2020, and by year-end 2020 the industry sat near $4.3 trillion.
Then the Fed started hiking in March 2022. The 7-day SEC yield climbed from 0.05% to a peak near 5.2% as the Federal Funds Rate hit 5.50% in July 2023. The money piled in. Total assets crossed $5 trillion in 2023, $6 trillion in 2024, $7 trillion in late 2025, and hit $7.77 trillion on the week ending May 20, 2026 per the Investment Company Institute’s weekly release.
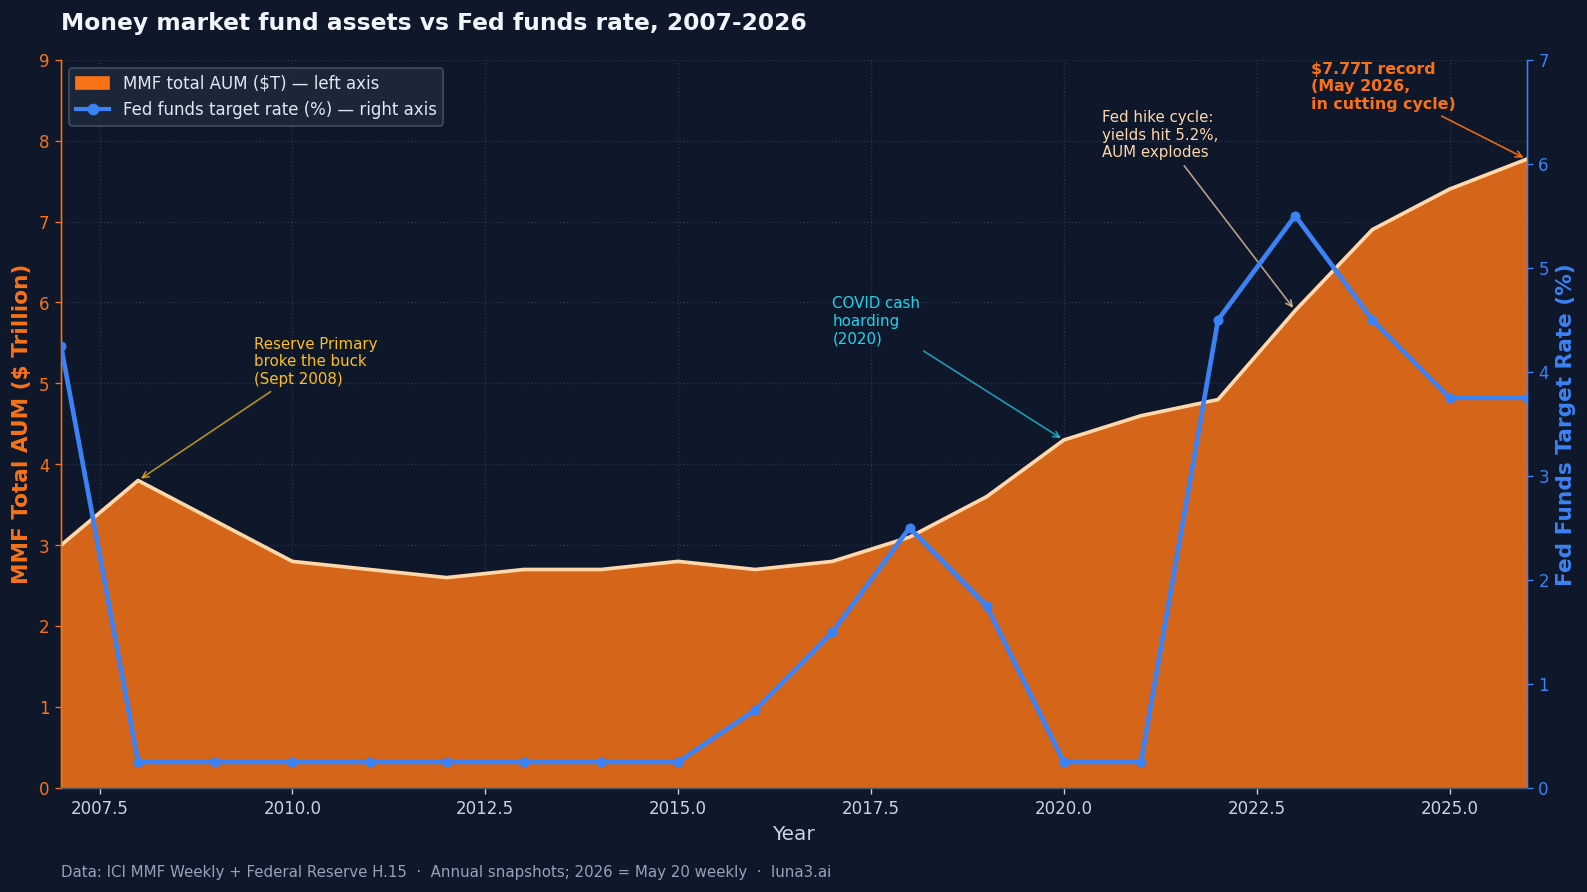
Here’s the cleaner way to see the arithmetic. A $25,000 cash holding earning 0.05% in a typical brokerage bank sweep generates $12.50 a year. The same $25,000 in SPAXX at the current 3.6% net yield generates roughly $900 a year. That ~$888 spread, multiplied across millions of accounts and institutional treasuries, is the entire flow story. The Fed has cut 175 bp since September 2024 and yields are well off their peak, but the spread to a bank sweep is still enormous, and that’s what keeps the AUM compounding.
The marginal dollar has come from four places: bank deposits (especially after the SVB-era deposit flight in 2023), brokerage sweep cash, fixed-income reallocations (investors preferring MMFs over short-duration bond funds to avoid NAV risk), and corporate treasury balances. As of May 2026, institutional MMF assets stand at $4.68 trillion — roughly 60% of the total — confirming this is no longer just a retail story. It also explains why the same fund-flow data that documented the $640B exit from active mutual funds in 2025 has shown sustained inflows into the cash bucket.
The top money market funds compared in 2026
Two firms dominate the space. Per Crane Data, Fidelity sits at 20.5% market share ($1.633 trillion), JPMorgan at 10.8% ($859.7 billion), Vanguard at 9.3% ($740.2 billion), and BlackRock and Schwab round out the top five at roughly 52 to 55% combined. The funds retail actually transacts in, ranked by relevance:
SPAXX — Fidelity Government Money Market Fund. About $319 billion in assets, 0.42% expense ratio, government fund. Fidelity’s default sweep — uninvested cash automatically earns the SPAXX yield without an explicit purchase. The single biggest reason to default-broker at Fidelity if you carry meaningful idle cash.
FZDXX — Fidelity Money Market Fund Premium Class. Prime fund, 0.30% expense ratio, $100,000 minimum on a standard taxable account. Typically yields 10 to 20 bp above SPAXX because of the prime-paper allowance. Worth the switch if balances justify the minimum.
SWVXX — Schwab Value Advantage Money Fund. About $249 billion in assets, 0.34% expense ratio, prime fund. Schwab’s brokerage sweep is a bank sweep yielding around 0.40% — SWVXX is what you actually want to hold, but it requires a manual purchase. The yield gap between Schwab’s bank sweep and SWVXX is one of the widest among major brokerages.
VMFXX — Vanguard Federal Money Market Fund. Vanguard’s default sweep, 0.11% expense ratio (the lowest in the gov category), government fund. The institutional-quality choice for accounts custodied at Vanguard directly.
VUSXX — Vanguard Treasury Money Market Fund. 0.09% expense ratio, close to 100% direct Treasury holdings. The key feature is state-tax exemption — Treasury interest is exempt from state and local tax in most US states, so a high-bracket investor in a high-tax state (California, New York, Massachusetts) often gets a better after-tax yield from VUSXX than from a higher-yielding prime fund.
SGOV — iShares 0-3 Month Treasury Bond ETF. Technically an ETF rather than a money market fund, but functionally identical for retail use. 0.09% expense ratio, trades like a stock during market hours, can be held in any brokerage account. The same wrapper-versus-fund choice we covered in ETFs vs mutual funds: in this corner of the market the ETF wrapper buys portability across brokers, the MMF wrapper buys default-sweep convenience.
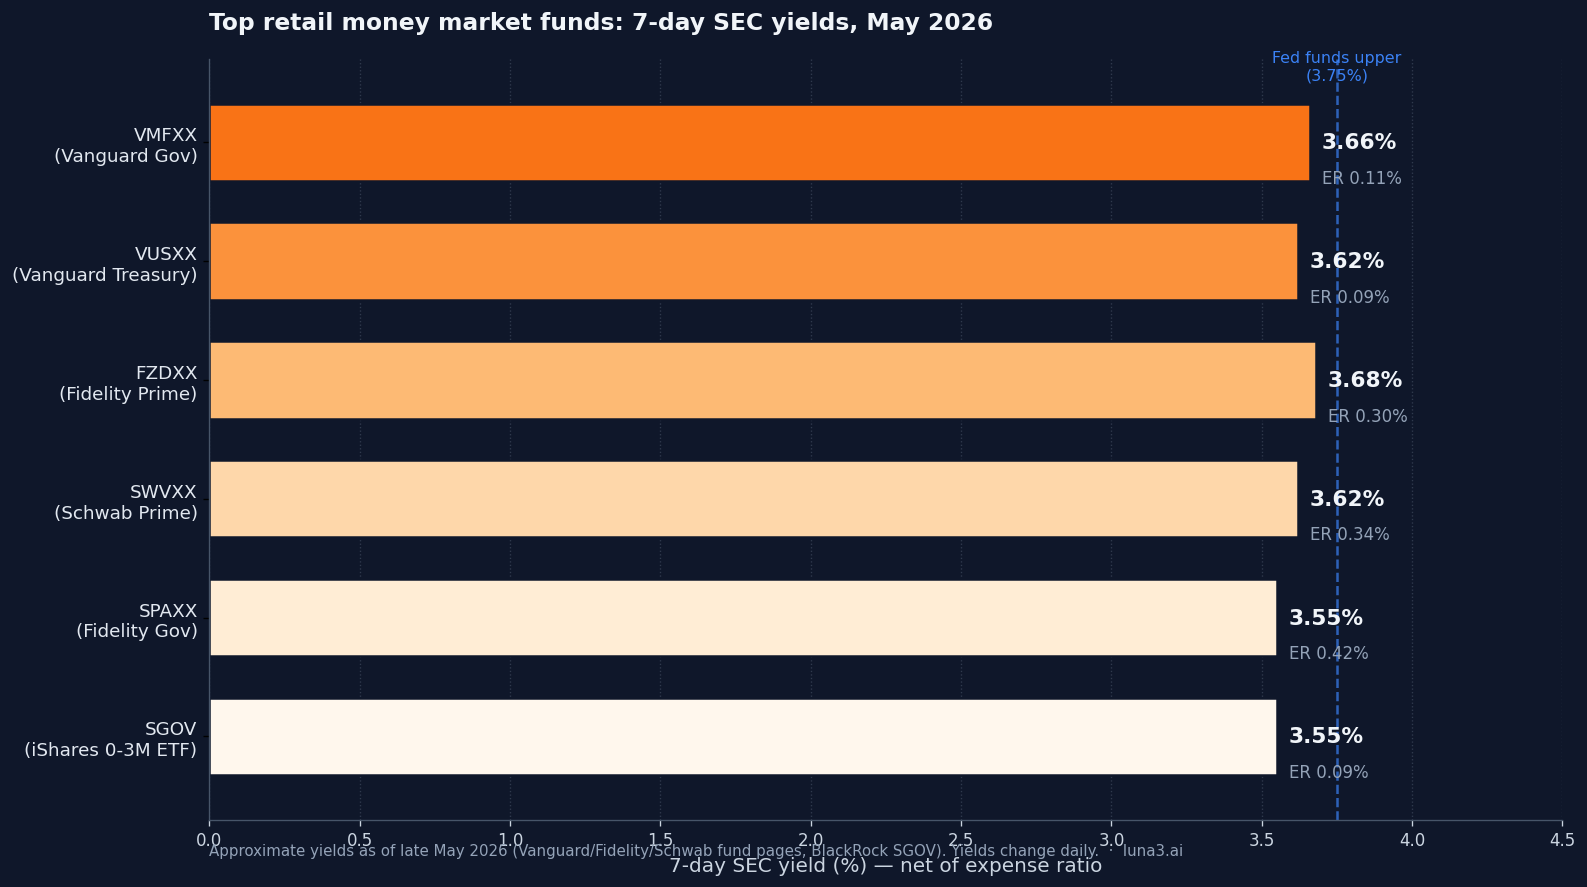
The decision tree compresses to three questions. Are you in a high tax bracket and a high-tax state? VUSXX or its Treasury equivalent. Do you broker at Schwab or hold the cash in a non-Fidelity/Vanguard account? SWVXX or SGOV. Do you broker at Fidelity? SPAXX as the default, with an FZDXX upgrade if balances exceed $100,000. The after-fee yield spread between best-in-class and average is 20 to 40 bp — modest in isolation, but compounded against the much wider gap to a default bank sweep, the choice matters more than the marketing decks suggest.
The risks the marketing decks skip
Money market funds are not zero-risk. The marketing language (“cash equivalent,” “safe as cash”) elides four real exposures.
Breaking the buck. It’s happened twice in the industry’s history. The Community Bankers US Government Money Market Fund — an ~$80 million institutional-only fund — paid out 96 cents on the dollar in 1994 after losses on Federal Home Loan Bank and Sallie Mae structured notes during that year’s rate spike. The Reserve Primary Fund repeated the trick in 2008, as covered above. In both cases retail investors were eventually made whole, but the days between event and resolution involved account freezes and real uncertainty about whether the headline value would hold.
Redemption fees after the 2023 SEC reform. The SEC’s final amendments to Rule 2a-7, adopted July 12, 2023 and effective in stages through June 2024, removed all redemption gates and replaced them with mandatory liquidity fees for institutional prime and institutional tax-exempt funds. The fee triggers when daily net redemptions exceed 5% of the fund’s NAV, unless the fund’s liquidity costs are de minimis (less than one basis point). Retail prime funds got the gates removed and kept the option for discretionary fees at the board’s call. The new structure makes a Reserve-Primary-style overnight collapse less likely but doesn’t eliminate redemption friction during stress.
The SIPC misconception. Money market funds are not FDIC insured. SIPC covers brokerage failure — the custody question — not loss of money market fund value. The two protections solve different problems, and the conflation is one of the most common misunderstandings in retail finance.
Yield risk under a cutting cycle. Money market fund yields move within roughly a week of any policy-rate change because the weighted-average maturity of the underlying portfolio is capped at 60 days. The 3.6% yield on the top retail funds today is already 160 bp below the 2023 peak. If Kevin Warsh’s Fed cuts a further 75 to 100 bp through 2026 — which the market is currently pricing as close to a coin flip — yields drop to roughly 2.5%. At that point the spread to short-duration IG bond funds compresses, and the rotation thesis finally has an audience.
What actually triggers the rotation
The rotation narrative anchors on the wrong variable. Strategists tell viewers the money will move when equities rally, when sentiment turns, when Fed cuts begin. The historical data shows the trigger is none of those things. The trigger is yield spread.
Total money market fund assets have only meaningfully decreased in three windows since 1990. The 2003-2007 cycle saw the Fed cut the policy rate to 1%, the 7-day yield fell to ~0.8%, and MMFs lost roughly $200 billion over three years as cash migrated into short-duration bond funds and equities. The 2009-2013 post-GFC zero-interest-rate window held yields near zero and AUM stayed flat-to-down as cash chased any alternative paying something. The 2020-2021 COVID ZIRP period drained about $400 billion out of MMFs, mostly into fixed income, not equities.
The common thread is the spread to the next-best risk-equivalent alternative — short-duration Treasuries, short-duration investment-grade bond funds, even high-yield savings accounts. When MMF yields dropped 100+ bp below those alternatives, money moved. When they didn’t, money stayed.
The 2026 calculus is exactly this. The Fed has already cut 175 bp since September 2024. MMF yields have dropped from ~5.2% to ~3.6%. Yet AUM keeps climbing — because the spread to alternatives is real but still below the historical migration trigger. The 2-year Treasury sits near 4.07%, only about 45 bp above the typical retail MMF yield. Short-duration IG ETFs like BIL and SHV are yielding within 10 to 20 bp of MMFs after fees. A 45 bp pickup on 2-year duration is below the 50-to-100 bp inversion that has historically pulled money out of money funds — meaningful, but not yet decisive. Kevin Warsh’s swearing-in on May 22, 2026 as the most hawkish realistic Fed Chair in a decade has reinforced the stickiness: market-implied 2026 cuts have compressed, and the case for taking 2-year duration over MMFs hasn’t sharpened enough to flip the flows.
What we’re watching: the spread between the 2-year Treasury yield and the MMF 7-day SEC yield. The historical migration trigger fires when MMF yields drop 50+ bp below the 2-year — exactly what happened in 2003-2007 and 2020-2021. We’re at roughly 45 bp today and trending in that direction. One more Fed cut, or a 2-year selloff, gets us there. Until then, the $7.77 trillion stays where it is. The same question applies in a different form to anyone running a 60/40 or balanced portfolio: the cash bucket has rarely earned its weight as well as it does now, and the alternatives haven’t yet sweetened the case for moving it.
Bottom line
The $7.77 trillion in US money market funds is not a coiled spring waiting to release into equities. It’s a yield product that responds to the spread between its own yield and what’s available elsewhere on the curve — not to S&P 500 momentum, not to sentiment, not to “rate cuts” in the abstract. The Fed has already cut 175 bp without moving this money. Watch the 2-year Treasury versus MMF yield spread. That’s where the trigger lives.
Get early access to Orbit
Orbit is Luna3.ai’s AI-augmented research engine. 12 algorithmic signals + a gradient-boosted ML model + an agentic LLM that reads each top pick’s filings and writes a daily thesis with conviction score and catalyst proximity. Three regimes, three playbooks — growth in expansion, defensives in late-cycle, recovery plays at panic bottoms. The 3 in Luna3.ai.
No spam. Unsubscribe any time.
No comments yet. Be the first to share your thoughts!