- Dollar-cost averaging means investing a fixed amount on a fixed schedule, no matter where the market is
- Over 20 years of $500/mo into VTI, you would have contributed $120,000 and ended with roughly $512,000 — about 4.3x your money
- Vanguard's own research shows lump sum beats DCA about two-thirds of the time. DCA is risk management, not return optimization.
Dollar-cost averaging is the most popular retail-investing strategy in America, and almost no one calls it by name. Every 401(k) contributor doing it. Every Roth IRA holder with an auto-deposit doing it. Every target-date fund saver doing it. The mechanism is plain: a fixed dollar amount, on a fixed schedule, into the same investment, regardless of price. The marketing pitch is that you buy more shares when prices are low and fewer when they are high. That part is true. What gets quietly skipped over is that Vanguard’s own research shows lump-sum investing actually wins about two-thirds of the time. So why does DCA still make sense? Because most people don’t have a lump sum — they have a paycheck. This piece walks through the 20-year math on $500 a month into VTI, names the tradeoff honestly, and gives you a framework for picking between the two when you actually have a choice.
For the math that follows, we use Vanguard’s total US stock market ETF — ticker VTI — which last printed $363.63 going into publication on May 19, 2026. VTI holds every US-listed common stock weighted by market cap and has been the standard retail proxy for “the US stock market” since it launched in 2001.
What is dollar-cost averaging, actually?
The SEC’s plain-English definition is investing a fixed dollar amount at fixed intervals, regardless of price. Pick a number — say $500. Pick an interval — say the first of every month. Pick an investment — say VTI. Then you put $500 into VTI on the first of every month, and you don’t look at the price.
Here is the entire trick. In a month where VTI trades at $250 per share, your $500 buys two shares. The next month VTI drops to $200 — your $500 now buys 2.5 shares. Then VTI rips to $300 — your $500 buys 1.67 shares. After three months you’ve spent $1,500 and own 6.17 shares. Your average cost per share is $243.11, even though the simple average of the three prices was $250. You bought more shares when they were cheap and fewer when they were expensive, automatically, without making a decision.
The “averaging” in dollar-cost averaging refers to that effect on cost basis. It is not a magic trick — it is just a mechanical consequence of holding the dollar amount constant while the price varies. The translation in plain English is that you stop pretending to know when the bottom is. You stop trying to time the market, because the schedule does the timing for you.
The 20-year math: $500/mo into VTI vs $120K lump sum
Let’s run the math on two retail investors over the past 20 years. Investor A starts January 2006 and puts $500 into VTI on the first of every month, every month, through December 2025. That is 240 contributions of $500 each — $120,000 total contributed. Investor B has $120,000 sitting in a checking account on January 1, 2006, and drops the entire lump sum into VTI on day one. No further contributions. Both reinvest dividends.
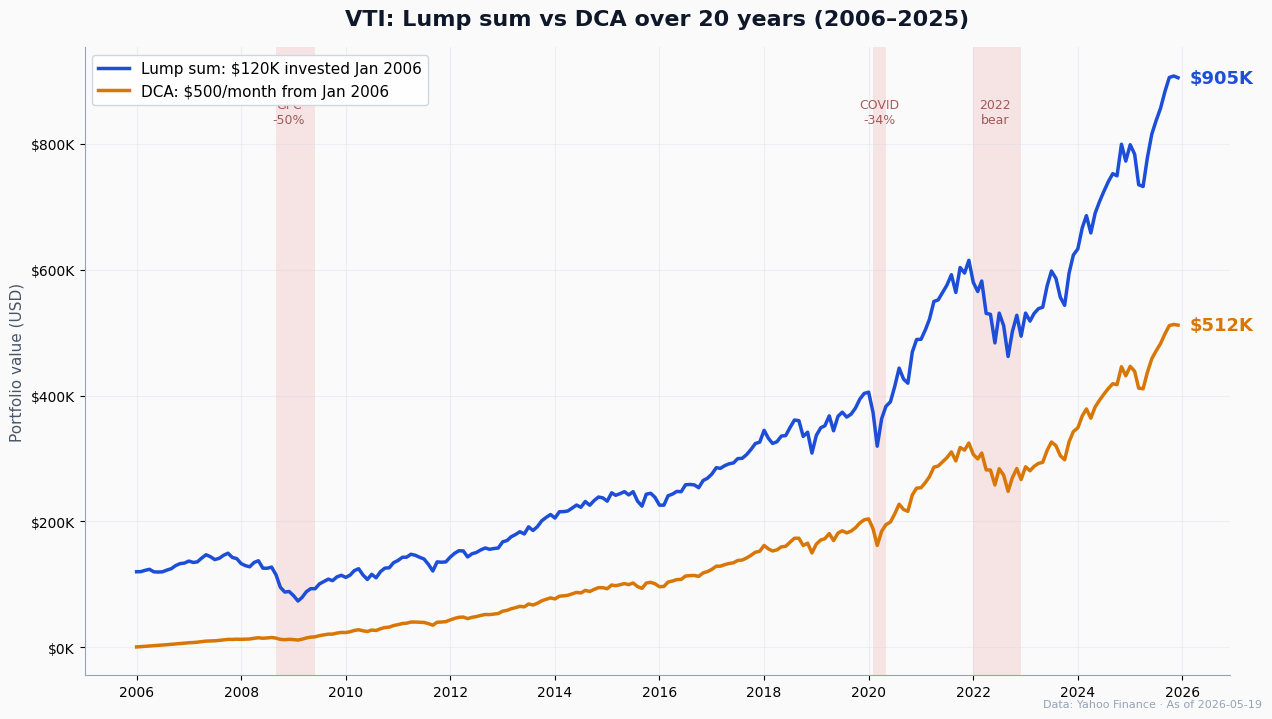
Here is what actually happened. The lump-sum investor ended December 2025 with approximately $905,000. The DCA investor ended with approximately $512,000. Both started with the same $120,000 of capital to deploy. The gap is enormous — almost $400,000 — and it is not because DCA is a worse strategy. It is because the lump-sum investor had 20 full years of compounding on the entire $120,000, while the DCA investor had an average of about 10 years of compounding on the average dollar invested. The first contributions sat in VTI for 20 years; the last contributions sat for one month.
The DCA investor was not punished. They turned $120,000 of contributions into $512,000, which is a respectable 4.3x. The lump-sum investor was just rewarded more — they captured the full 7.5x total return that VTI delivered over the window (a 10.6% annualized return through the global financial crisis, the COVID crash, and the 2022 bear market). The honest framing is not “DCA loses.” It is “the lump-sum investor took a lot more risk on day one, watched a 50% drawdown in 2008 on the full $120K, and got paid for that risk.”
When DCA wins (and when lump sum beats it)
The most rigorous public research on this question comes from Vanguard. Their 2012 paper “Dollar-Cost Averaging Just Means Taking Risk Later” backtested DCA performed over 12 months against immediate lump-sum, measured across rolling 10-year holding periods in US data going back to 1926 — over 1,000 scenarios in total. They ran the same study in UK data (1976–2011) and Australian data (1984–2011) for triangulation. Lump sum beat DCA in roughly 67% of US windows. The 2023 Vanguard update on global MSCI World data 1976–2022 came in at 68%. The result is sturdy.
The mechanism is also sturdy: markets go up more often than they go down. The US stock market has produced positive returns in something like 70–75% of all 12-month windows since 1926. Every month an investor sits in cash waiting to deploy is a month they have under-earned on average. Time in the market beats timing it, and DCA is a soft, polite form of trying to time the market.
But the variance is asymmetric. In the 33% of windows where DCA beat lump sum, those windows were market downturns — 2000–2002, 2008, 2022. The lump-sum investor of January 2008 was staring at a 52% paper loss by March 2009 on their full $120,000 — VTI fell from roughly $76 in early January to $37 at the March 9 bottom. The DCA investor of January 2008 was averaging in at the bottom of the GFC, buying nearly twice as many shares per $500 in early 2009 as they had in late 2007, and finished 2009 in profit. The DCA “wins” are real. They are mostly psychological wins — the investor stayed invested through the panic instead of selling at the bottom — but the math books them as wins all the same.
So the honest framing is this: DCA delivers lower expected return, lower variance. Lump sum delivers higher expected return, higher variance. Lump sum wins on average. DCA wins when you cannot stomach a 30% drawdown on the full amount without panic-selling. The right choice depends on how you actually behave when markets fall, not on which strategy has the better backtest in a calm year.
Three places you’re already DCA’ing without realizing it
The reason DCA is the dominant US retail strategy is not because retail investors all studied Vanguard’s research and agreed to do it. It is because the entire American retirement infrastructure is built on DCA, by default, automatically, without asking. If you are employed and contributing to retirement, you are already DCA’ing — the question is just whether you also want to DCA in your taxable brokerage account.
- Your 401(k) contributions. Every paycheck, a fixed percentage of your gross pay goes into the plan menu. The contribution is the same dollar amount (give or take a raise) every cycle, into the same allocation, regardless of where the market is. This is pure DCA, fully automated, and tax-deferred on top.
- Your automatic IRA contributions. Fidelity, Schwab, and Vanguard all let you schedule a fixed contribution from your bank account into a Roth or Traditional IRA on a recurring basis — most people set it for $500 or $625 a month to hit the annual cap. Same mechanism, different tax wrapper. See our breakdown of Roth versus Traditional IRA breakeven math for the wrapper choice itself.
- Target-date funds. When you pick “Vanguard Target Retirement 2055” inside your 401(k), the fund itself reallocates over time, glide-pathing from equities into bonds as you approach retirement. Your contribution stream is still DCA — the fund just adjusts the mix as you age. Roughly 60% of Vanguard 401(k) participants sit in a single target-date fund today, per Vanguard’s 2025 How America Saves report.
If you are already DCA’ing in your retirement accounts, the marginal question is what to do with money outside that envelope — a bonus, an inheritance, a windfall from selling a house, savings that have piled up in a checking account. That is the only case where DCA versus lump sum is a real decision.
A simple framework for choosing between DCA and lump sum
Here is the actual decision tree. Run through it the next time you have cash to deploy.
- Do you have a lump sum right now? If no — you are a paycheck contributor — you are DCA’ing by definition. Skip to step 3 and pick an allocation. If yes, continue.
- Can you watch a 30% drawdown on the full amount without selling? If yes, lump sum maximizes expected return — Vanguard’s data says you win two-thirds of the time. If no, DCA is the better strategy even though it is lower return on average, because it prevents the worst outcome: panic-selling at the bottom and locking in a permanent loss. Behavioral discipline beats math optimization when the math optimum makes you sell.
- What is your investing horizon? Under three years — neither strategy fits, and you should not be in equities with that money. Three to ten years — DCA, because a single bad entry month can hurt for a window that short. Ten years or more with $50K-plus of cash sitting idle — lump sum has the strongest tailwinds because the time-in-market advantage compounds the most.
The systematic-investor way to frame this is that DCA is a utility-function choice, not a return-maximization choice. You are trading a small expected-return penalty (about 2.3% on a 12-month deployment, according to Vanguard) for a much smaller variance and a much smaller chance of catastrophic regret. The “right” answer depends on your tolerance for regret, your cashflow position, and your horizon — not on which one beats the other in a backtest.
One more thing worth saying out loud: a halfway move works too. If you have $120K but cannot stomach deploying all of it at once, deploying $60K immediately and DCA’ing the other $60K over six months captures most of the lump-sum advantage while cutting the variance roughly in half. Vanguard’s research shows the lump-sum win rate climbs from 67% (at 12-month DCA) to about 90% (at 36-month DCA) — the longer you DCA, the more time-in-market you give up. Six months is a reasonable compromise. Three years is not.
Bottom line
Dollar-cost averaging is the right strategy for most retail investors because most retail investors do not have lump sums — they have paychecks, and DCA is what a paycheck does to a brokerage account. The mechanism works exactly as advertised: you buy more shares when prices are low, fewer when prices are high, and you stop trying to time the market. The 20-year math on $500 a month into VTI turns $120,000 of contributions into about $512,000.
What gets oversold is the framing that DCA beats lump sum. It does not, on average — Vanguard’s own data has been consistent on this for over a decade. What DCA does is reduce the variance and remove the timing decision, which is almost always the right tradeoff for an investor who would otherwise sit in cash waiting for the perfect entry. The real value of DCA is behavioral. It keeps you invested through the periods that would otherwise scare you out of the market. The number that compounds is the number you do not panic-sell. The strategy that wins is the one you can actually follow for 20 years. By that test, dollar-cost averaging earns its place as the default — but it earns it for reasons most explainers get half-right.
Companion reading: VOO vs VTI for the underlying ETF choice, ETF expense ratios — the other small number that compounds, and What is a P/E ratio for the next number in our Knowledge series.
Get early access to Orbit
Orbit is Luna3.ai’s AI-augmented research engine. 12 algorithmic signals + a gradient-boosted ML model + an agentic LLM that reads each top pick’s filings and writes a daily thesis with conviction score and catalyst proximity. Three regimes, three playbooks — growth in expansion, defensives in late-cycle, recovery plays at panic bottoms. The 3 in Luna3.ai.
No spam. Unsubscribe any time.
No comments yet. Be the first to share your thoughts!