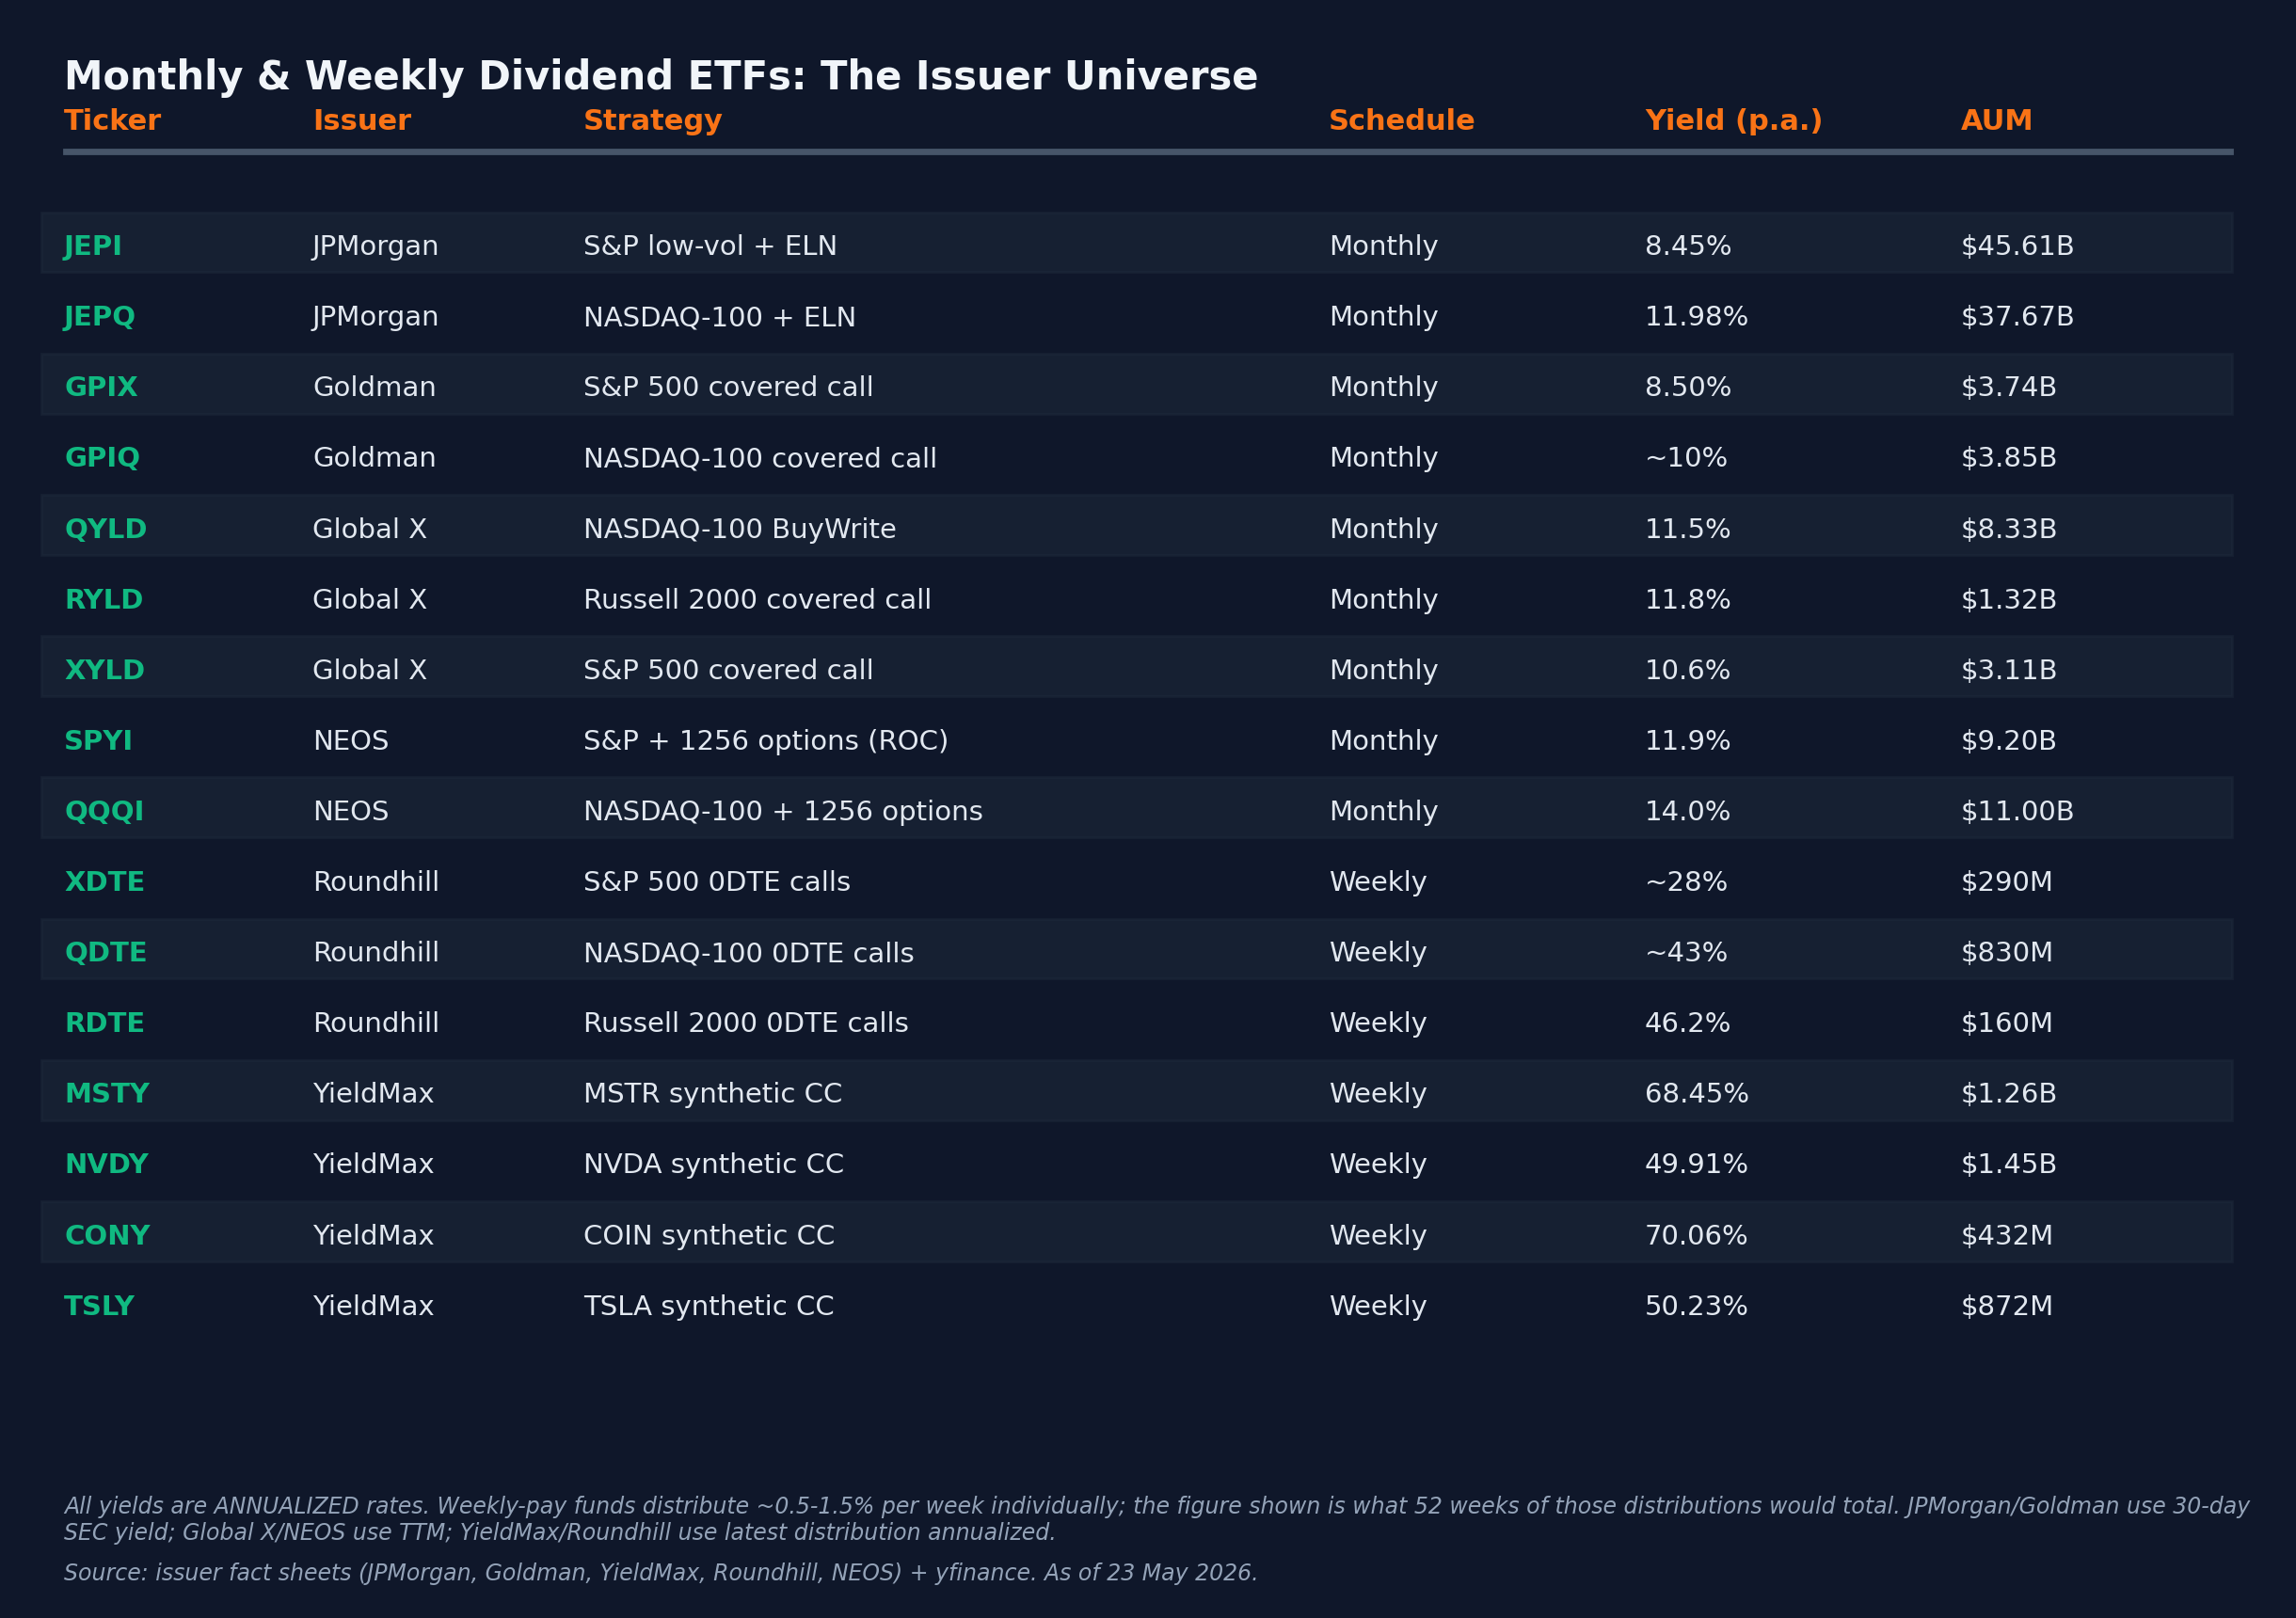
- The covered-call ETF category now spans $160B+ across 94 funds. JEPI ($45B) and JEPQ ($37.7B) alone hold roughly half the category by AUM
- Headline yields range from 8% on JEPI to 68%+ on YieldMax's MSTY — but the yield is manufactured from option premium, not dividends, which caps total return
- Over 3 years JEPI returned +29.9% total return with dividends reinvested while SPY returned +85.4% — the 55.5pp gap is the structural cost of selling upside
The covered-call ETF category quietly turned into one of the biggest active-ETF stories of the cycle. Monthly dividend ETFs now span 94 funds with $160 billion in combined assets, and weekly-pay 0DTE products from Roundhill have made the income-ETF arms race even more crowded. JPMorgan’s JEPI alone holds $45 billion. JEPQ holds $37.7 billion. Together they’re roughly half the entire category by AUM — and they’re not even the highest-yielding products in it.
This piece maps that universe by issuer and strategy. We won’t tell you which one to buy — we’ll show you what each one actually does to manufacture the yield, why the headline distribution rate is not the same as total return, and where each product structurally fits (or doesn’t fit) in a portfolio.
How monthly dividend ETFs actually generate the yield
None of these funds are paying dividends in the traditional sense — owning stocks that pay distributions and passing them through. The yield comes from selling option premium. There are three mechanism variants used across the category, and they have meaningfully different risk profiles:
- Index covered calls (Global X QYLD, RYLD, XYLD; Goldman GPIX, GPIQ) — the fund holds the underlying index basket (or a sample of it) and sells call options against the position. Premium received becomes the distribution. Most retail-familiar covered-call strategy.
- Equity-linked notes (ELNs) (JPMorgan JEPI, JEPQ) — the fund holds a defensive low-volatility stock portfolio AND a basket of bank-issued ELNs that replicate the payoff of a one-month out-of-the-money covered call on the index. The ELN coupons are passed through as monthly distributions. Slightly more complex but structurally similar to a covered call.
- Synthetic single-name covered calls (YieldMax MSTY, CONY, NVDY, TSLY) — the fund does NOT own the underlying stock at all. Instead it uses options to synthetically replicate the stock’s exposure (long call + short put) AND writes covered calls on top, with US Treasuries as collateral. Per the MSTY 497K SEC filing, the synthetic long uses 1-6-month at-the-money calls and puts; the covered calls are 0-15% out-of-the-money with one-month expirations.
- 0DTE weekly covered calls (Roundhill XDTE, QDTE, RDTE) — the fund holds the underlying index exposure overnight and sells zero-day-to-expiry calls each morning. Premium decays to zero by close; the fund captures it daily. Distributions are paid weekly.
The mechanism difference matters because each structure has a different total-return signature. Index covered calls cap upside on the basket but don’t have single-stock blow-up risk. ELN strategies (JEPI, JEPQ) cap upside via the note coupon and add modest credit risk to the issuing banks. Synthetic single-name strategies (YieldMax) inherit the underlying stock’s full downside, plus get capped on the upside, plus pay heavy option-related costs — which is why their NAV curves often diverge sharply from the underlying stocks they track.
The big-issuer universe — who runs what
JPMorgan dominates by AUM. JPMorgan’s JEPI fact sheet shows $45 billion in net assets and an 8.45% 30-day SEC yield as of March 31, 2026. JEPQ, the NASDAQ-100-linked sibling, holds $37.7 billion at an 11.98% 30-day SEC yield. Both use the equity-linked-note structure — own low-volatility stocks, layer in ELNs that pay out one-month OTM covered-call premiums on the underlying index. Distributions are monthly.
Goldman Sachs launched GPIX (S&P 500 covered call) on October 24, 2023 and quickly hit ~$4 billion in AUM. The sister fund GPIQ (NASDAQ-100 covered call) sits around $3 billion. Both pay monthly with distribution yields in the 8-10% range. Goldman undercuts JEPI on expense ratio — GPIX charges 0.29% vs JEPI’s 0.35% — with a slightly different mechanism that uses direct index options rather than ELNs.
YieldMax is the most distinctive product line. Run under Tidal Trust II, the YieldMax complex includes 30+ single-stock synthetic covered-call funds, all of which now pay weekly. MSTY (MSTR-linked) reports a 68.45% annualized distribution rate as of May 21, 2026; CONY (COIN) sits at 70.06%, NVDY (NVDA) at 49.91%, TSLY (TSLA) at 50.23%. Important detail on what these numbers mean: each fund distributes roughly 0.5-1.5% per week, and the headline yield is that weekly amount multiplied by 52 — it’s an annualized projection from the most recent week, not a guaranteed twelve-month figure. AUMs sit between $432M (CONY) and $1.45B (NVDY). Expense ratio is 1.03% (vs JEPI’s 0.35%).
Roundhill pioneered the 0DTE weekly-pay structure. Roundhill’s XDTE prospectus covers the S&P 500 version launched March 7, 2024; QDTE (NASDAQ-100) also launched that day; RDTE (Russell 2000) followed on September 10, 2024. These are the only US ETFs paying weekly distributions on 0DTE option income — they trade in and out of zero-day calls each market session, capturing the premium-decay curve.
NEOS built a tax-aware variant. SPYI and QQQI use S&P 500 and NASDAQ-100 index options (Section 1256 contracts), which qualify for blended 60% long-term / 40% short-term capital gains tax treatment. NEOS also classifies a large portion of distributions as return of capital — per NEOS’s 2024 distribution classification disclosure, roughly 98% of SPYI’s distributions were ROC. We’ll come back to ROC in the tax section.
Global X is the OG of the category. QYLD (NASDAQ-100 BuyWrite) launched December 12, 2013 — a full decade before the current boom. RYLD (Russell 2000) and XYLD (S&P 500) followed. AUM today is a combined ~$13 billion across the three. Defiance runs QQQY, IWMY, and SPYY with daily/weekly distribution schedules. There are dozens of smaller issuers (Amplify, Kurv, ProShares) competing for shelf space.
The yield vs total return tradeoff (the chart everyone skips)
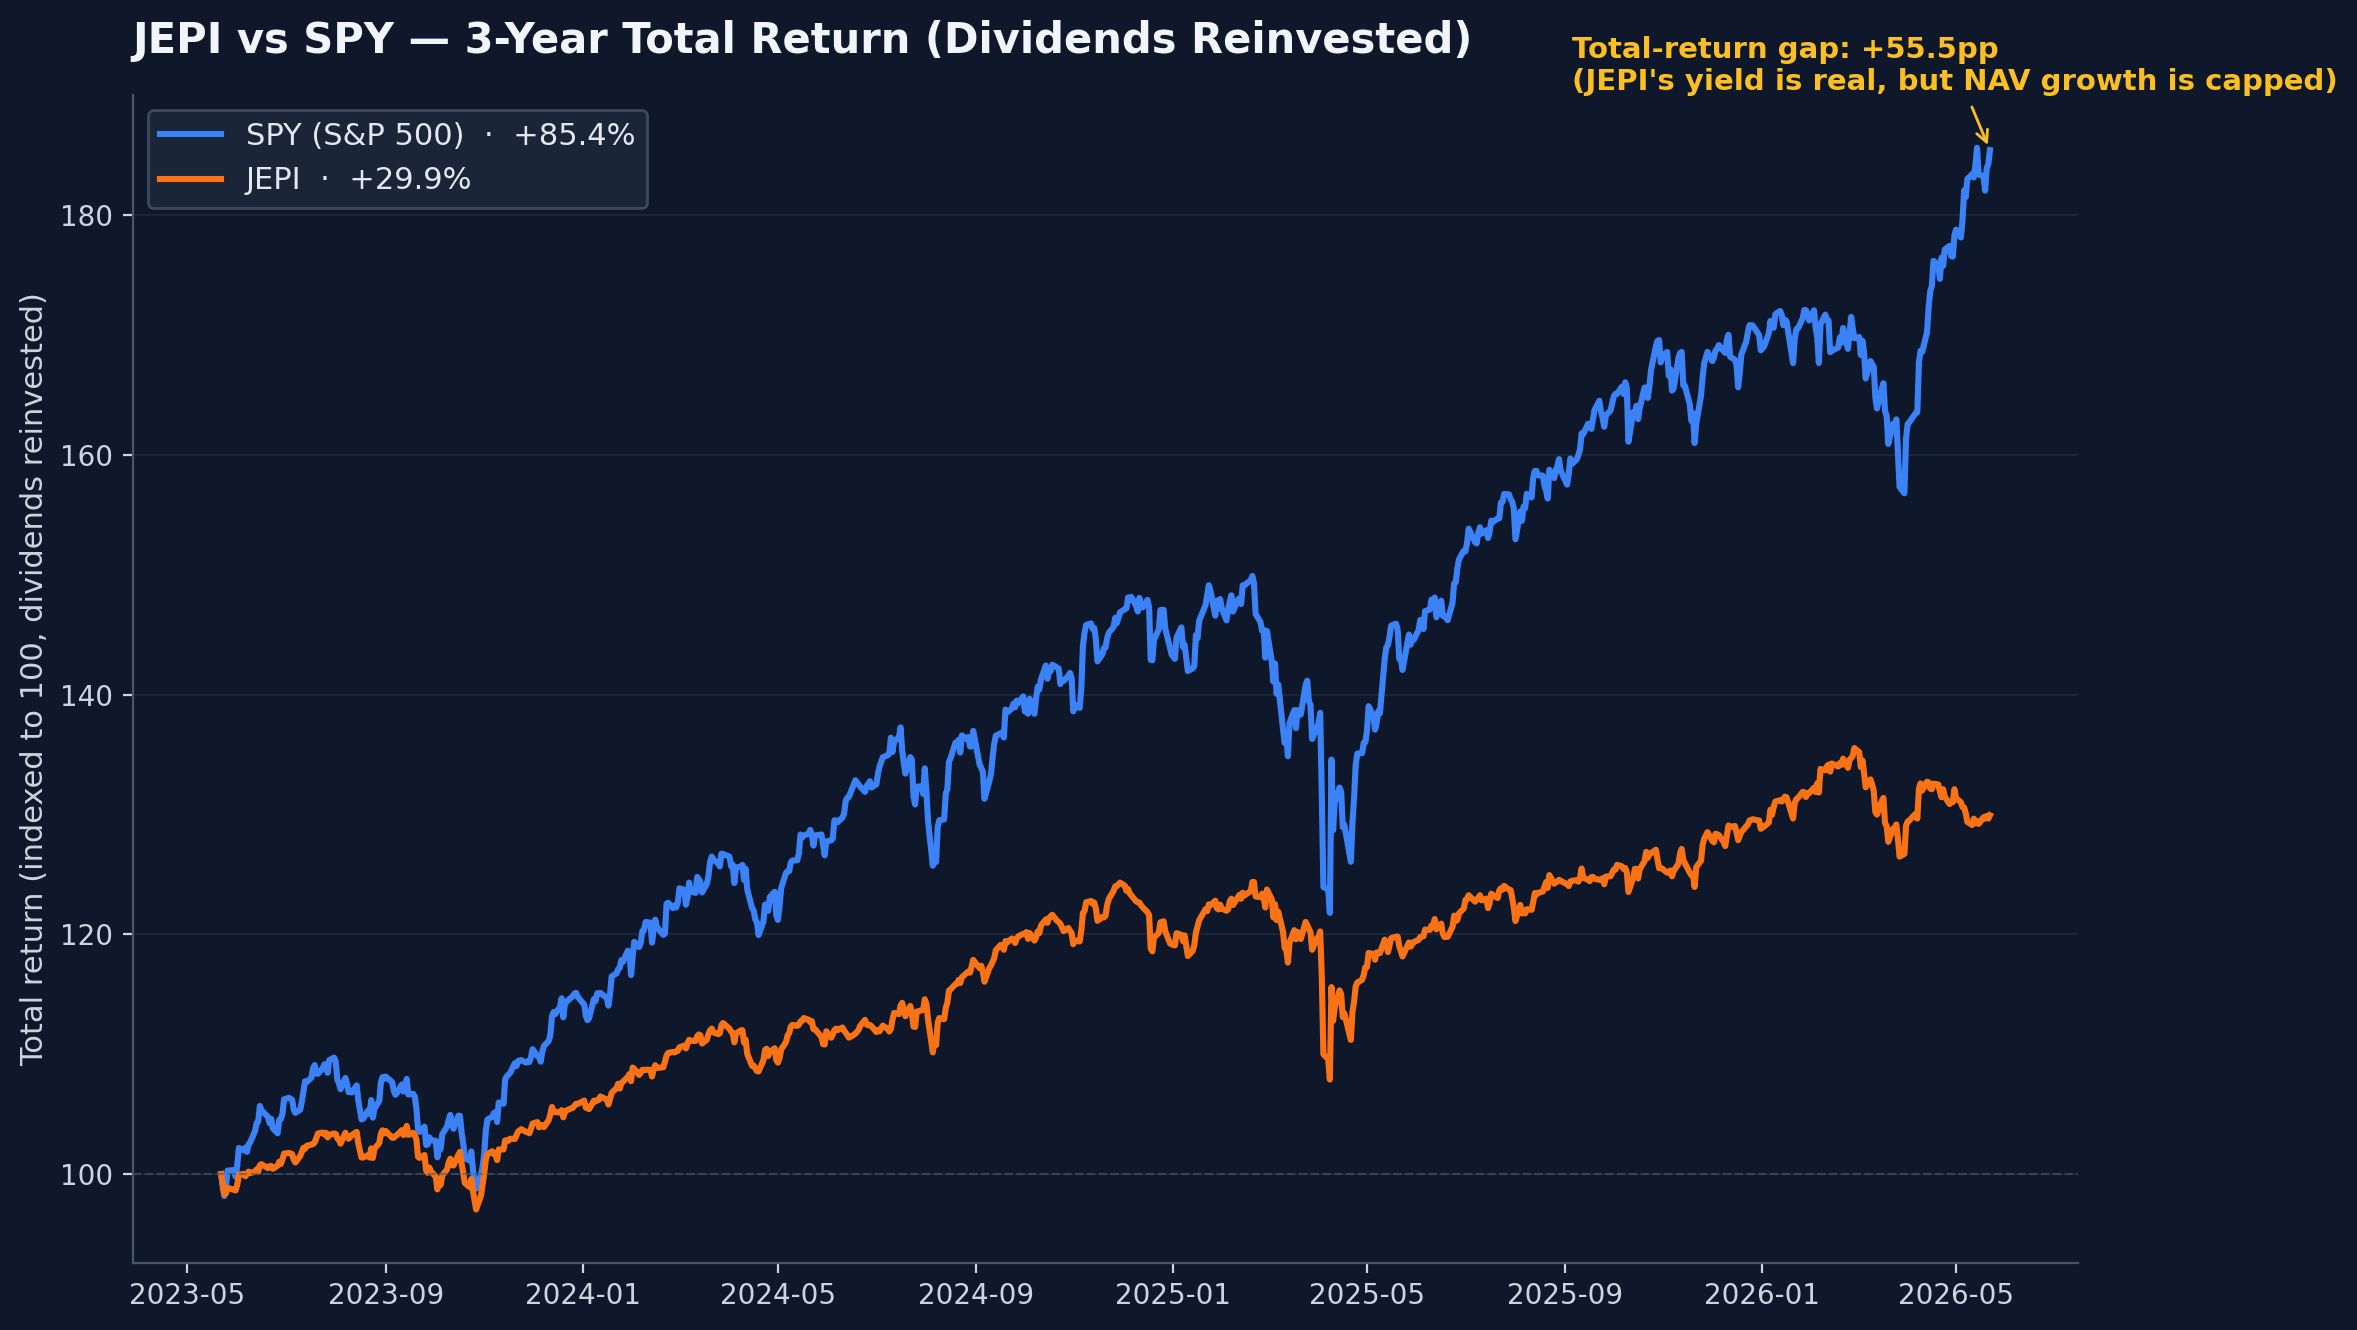
This is the chart most income-focused content avoids. Over the trailing three years, with all dividends reinvested, JEPI returned +29.9% total return — perfectly fine in absolute terms, and the income stream was real and predictable. Over the same window SPY returned +85.4% on a total-return basis. That’s a 55.5-percentage-point gap. JEPI’s investors collected meaningful monthly cash; they also left a lot of capital appreciation on the table during a strong bull market for tech and large-cap growth.
The structural reason is simple. Selling call options on the index means giving up the right to the upside above the strike. In a flat market the call expires worthless and the fund pockets the premium with no opportunity cost — that’s the best-case environment for these strategies. In a strong bull market the calls get assigned (or rolled at a loss) and the fund participates in only a fraction of the rally. Over three years JEPI captured roughly 35% of SPY’s total return. That ratio is structural, not bad management.
YieldMax single-name funds make the same tradeoff more dramatically. The 68%+ distribution rate on MSTY is real cash flow — but the underlying MicroStrategy stock is volatile enough that NAV erosion has been material when the underlying corrects. Over a full cycle the total return picture depends entirely on whether the underlying stock cooperates with the option strategy. Selling weekly calls during a sustained rally is the worst-case environment; selling them during a sideways grind is the best-case.
Tax treatment: ROC vs ordinary income
Distribution composition matters as much as distribution yield. Three tax buckets cover this category:
- Ordinary income — JEPI’s ELN coupons flow through as ordinary income. Taxed at the holder’s marginal rate. No tax efficiency advantage vs corporate bond yield.
- Return of capital (ROC) — NEOS funds (SPYI, QQQI) and most YieldMax funds classify a large share of distributions as ROC. ROC is not taxed in the year received; it reduces your cost basis. When you eventually sell, that lower basis means a larger capital gain. So ROC defers tax, but doesn’t eliminate it.
- Section 1256 60/40 treatment — when the option income is generated via broad-based index options (SPX, NDX), gains qualify for the IRS Section 1256 60% long-term / 40% short-term blend regardless of holding period. NEOS leans on this; some others do too.
Practical implication: tax-advantaged accounts (Roth IRA, traditional IRA, 401(k), HSA) are the cleanest place to hold these. The cash distribution doesn’t need tax shelter when the account itself is sheltered. Holding JEPI in a taxable account at a 32% marginal rate eats a meaningful chunk of the 8.45% yield before it compounds.
Who should use these — and who shouldn’t
The category does one thing very well and several things badly. What it does well: predictable monthly (or weekly) cash flow with somewhat lower volatility than the underlying index. What it does badly: total return in bull markets, capital preservation in steep drawdowns of the underlying single names, and tax efficiency in taxable accounts.
So the natural fit is income-stage investors who have already accumulated capital and now need monthly cash flow without selling principal. Retirees treating JEPI as a bond-substitute. Investors building a sleeve to cover specific monthly expenses. The fit is much worse for accumulators — when you’re 30, the compounding you give up by capping upside is the most valuable thing you own, and total return is what funds your retirement, not nominal yield. The dividend vs growth ETF tradeoff over 20 years covers this point at the broader portfolio level.
Position sizing tends to cap at 10-20% of a portfolio even among advisors who use these funds heavily. They’re a sleeve, not a core holding. Expense ratios also matter here — 0.35% on JEPI is reasonable, but 1.03% on YieldMax single-name funds is meaningfully higher than vanilla index ETFs, and small expense ratio differences compound into significant return drag over decades.
What to watch in the category
- New launches: YieldMax adds new single-name funds nearly every month; Roundhill continues to expand the 0DTE weekly-pay family; expect Goldman, BlackRock, and Vanguard to add more entries.
- AUM concentration: JEPI + JEPQ alone account for $78 billion of the $160 billion category. That’s a real competitive moat — most income-seekers default to the JPMorgan funds rather than evaluating the full universe.
- Tax filings: watch the 19a-1 distribution classification notices from each issuer monthly. If a fund’s distributions shift from 80% ROC to 100% net income (or vice versa), the tax picture changes meaningfully for taxable-account holders.
- The yield-trap question: retail comparison shopping that ranks ETFs purely by distribution yield (MSTY 68% > JEPI 8%, so MSTY wins) misses the total-return question entirely. Over a full cycle these comparisons need to include NAV trajectory + distributions + taxes. The broader ETF flow picture shows that income funds catch retail-flow waves quickly when yields look high — but the flow data lags the total-return picture by months.
The bottom line: these are tools, not free lunches. Used in the right context — income-stage portfolios, sheltered accounts, with eyes open on the NAV trajectory — they do what they advertise. Used as growth assets or chosen purely by yield-rank, they tend to disappoint. The honest comparison is total return, not headline distribution rate. If a piece of income-ETF content doesn’t show you the underlying-index total-return chart alongside the yield, that’s the missing piece. For more on how ETF wrappers compare structurally, see what an ETF actually is.
Get early access to Orbit
Orbit is Luna3.ai’s AI-augmented research engine. 12 algorithmic signals + a gradient-boosted ML model + an agentic LLM that reads each top pick’s filings and writes a daily thesis with conviction score and catalyst proximity. Three regimes, three playbooks — growth in expansion, defensives in late-cycle, recovery plays at panic bottoms. The 3 in Luna3.ai.
No spam. Unsubscribe any time.
No comments yet. Be the first to share your thoughts!