- SOXX (iShares) caps its top 5 holdings at 8% each, keeping NVDA at ~7%. SMH (VanEck) uses a looser 20% cap that lets NVDA run to ~17.5% — a 2.5x exposure gap.
- Expense ratios are nearly identical (SOXX 0.34% vs SMH 0.35%), so cost isn't the deciding factor. Construction is.
- YTD 2026, SOXX +67% has actually outperformed SMH +52% — the broader basket beat the NVDA-heavy basket. Over 5 years it flips: SMH wins on CAGR by ~6 points.
SOXX vs SMH is the question every retail investor with semiconductor exposure ends up asking, and most comparison guides answer it wrong. The two ETFs hold almost identical rosters of chip stocks — NVDA, TSM, AVGO, AMD, INTC, MU — and charge almost identical fees (0.34% vs 0.35%). Same sector, same names, same cost. So they should perform the same. They don’t. SOXX is up 67% year-to-date through May 2026; SMH is up 52%. Fifteen percentage points of gap, on what look like identical funds. The reason isn’t holdings or fees. It’s construction — specifically, how aggressively each fund caps its largest position. And that single mechanical difference quietly decides whether you’re making a diversified semis bet or a leveraged NVDA bet wearing an ETF wrapper.
SOXX vs SMH: the verdict in 4 lines
SMH is for investors who believe the AI cycle has more room and want the largest semi names to dominate the basket. Top 10 = 73% of the fund. NVDA at ~17.5%, TSM at ~9.7%. Looser cap = more concentration. Historically rewarded over 5 years (+38% CAGR vs SOXX’s +32%).
SOXX is for investors who want semi-sector exposure without betting the house on one or two names. Top 10 = 62% of the fund. NVDA capped at ~7%, MU and AMD at 8–9% each. Stricter cap = broader basket. Quietly outperforming SMH YTD 2026 (+67% vs +52%) as the memory/equipment names rally alongside NVDA.
If you already own a broad tech ETF (QQQ, VGT, XLK) and are adding a satellite semis position, the choice matters: SMH amplifies what you already own; SOXX diversifies it. The current YTD gap is rare. Most years SMH wins. So the question becomes whether you trust the construction or the recent tape.
What’s actually inside each ETF
Both funds source from largely the same investable universe — US-listed semiconductor and semi-equipment companies, with a few ADRs for the non-US names that matter (TSM above all). The roster overlap is roughly 80%. Where they diverge is in weight.
| Top 10 holdings | SOXX weight | SMH weight |
|---|---|---|
| NVIDIA (NVDA) | ~7.0% | ~17.5% |
| Taiwan Semi (TSM) | ~6.0% | ~9.7% |
| Broadcom (AVGO) | ~7.3% | ~7.3% |
| Micron (MU) | ~9.6% | ~5.5% |
| AMD | ~8.7% | ~6.7% |
| Intel (INTC) | ~6.9% | ~7.7% |
| Applied Materials (AMAT) | ~4.5% | ~5.0% |
| Lam Research (LRCX) | ~4.2% | ~5.0% |
| KLA Corp (KLAC) | ~4.2% | ~4.5% |
| ASML | ~3.5% | ~5.0% |
| Top 10 = % of fund | ~62% | ~73% |
The headline number is the NVDA row. SMH gives you 2.5x more NVDA exposure than SOXX. If your view is “NVDA is the AI cycle,” that’s the trade. If your view is “the AI cycle is broader than NVDA — memory, equipment, foundry, custom silicon,” SOXX gives you more of those names. MU is twice the weight in SOXX (9.6%) as in SMH (5.5%), which matters when the memory cycle inflects.
This is also where the comparison to a broader tech wrapper matters. The ETF wrapper structure doesn’t determine concentration risk — index methodology does. Two ETFs holding the same names can produce very different return profiles depending on how the index decides each weight.
Construction methodology — the cap that quietly decides everything
Both ETFs use modified market-cap weighting. The difference is how strict the cap is.
SOXX tracks the NYSE Semiconductor Index (the same index that used to be called the PHLX Semiconductor or ICE Semiconductor Index — rebranded but mechanically identical). The cap rule is two-tiered: the top 5 holdings are each capped at 8%, and every other holding is capped at 4%. ADRs as a group are capped at 10% cumulatively. The fund rebalances quarterly in March, June, and December, and reconstitutes annually in September — meaning weights drift between rebalances, but a runaway winner like NVDA gets pulled back down to 8% at the next quarterly reset. Methodology details are in the published NYSE/Nasdaq SOX Index methodology PDF.
SMH tracks the MVIS US Listed Semiconductor 25 Index — a 25-name index built by MarketVector (a VanEck subsidiary). The cap is much looser: individual holdings are capped around 20%. The MVIS index reviews semi-annually in March and September, with quarterly weight rebalances in between. The full MVIS index methodology spells this out.
The mechanical implication is straightforward. When NVDA’s market cap doubles, SOXX’s cap rule forces a rebalance that trims NVDA back toward 8% and redistributes the weight across the other names. SMH’s looser cap lets NVDA’s weight climb as its market cap climbs — until it hits ~20%. So during an NVDA-led rally, SMH’s NVDA position runs ahead of SOXX’s; during the next quarter’s SOXX rebalance, that gap widens further as SOXX trims NVDA and tops up MU, AMD, AVGO. Two ETFs holding the same stock for a year produce different returns because one is letting it run and one is rebalancing it away.
Performance: where SOXX vs SMH actually splits
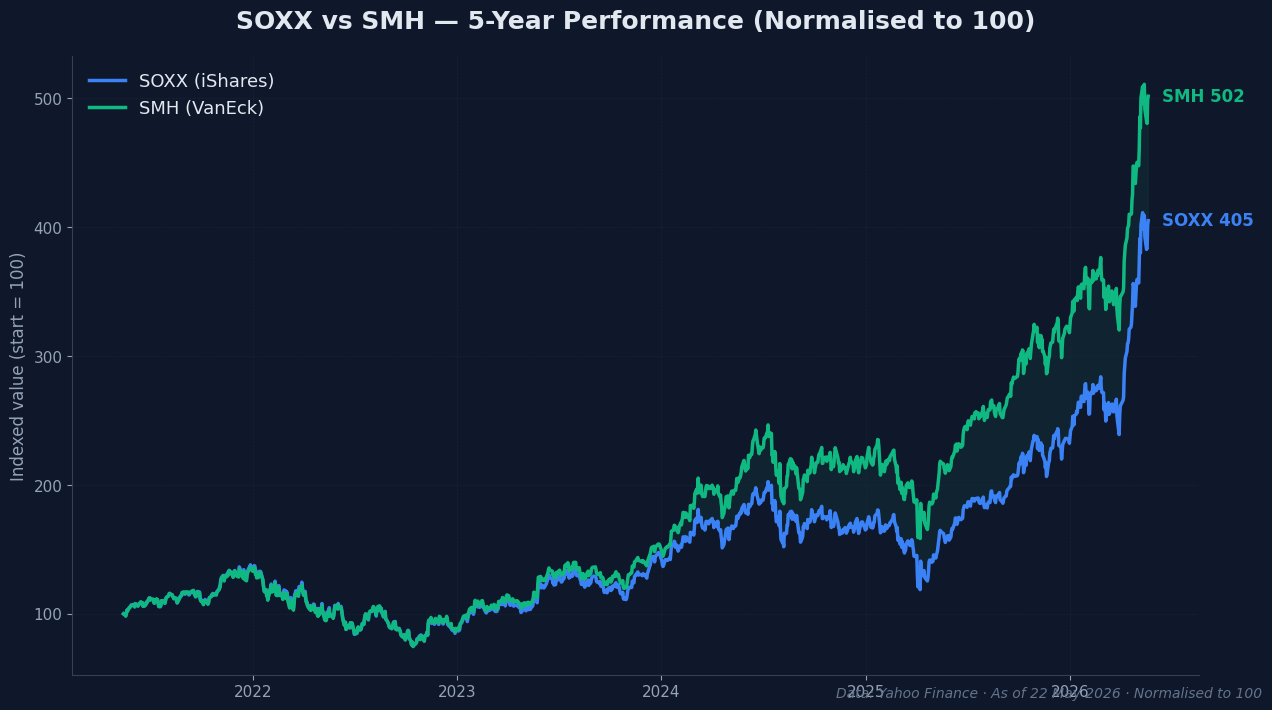
The five-year chart tells the historical story: SMH has outperformed SOXX. Indexed to 100 at start, SMH is sitting around 502 and SOXX around 405 as of late May 2026 — roughly 24 percentage points of cumulative outperformance. That translates to a 5-year CAGR of +38.1% for SMH vs +32.3% for SOXX. The construction difference compounded.
But the YTD 2026 picture is the opposite. SOXX +67.4% vs SMH +52.1% through May 22. Fifteen percentage points the other way. The reason is that this year’s semi rally has been broader than 2023–2024’s NVDA-only run. MU’s memory pricing cycle inflected, the equipment names (AMAT, LRCX, KLAC) rallied on capex commentary, and SOXX’s larger weight in those second-tier names paid off.
| Performance | SOXX | SMH | Spread |
|---|---|---|---|
| YTD 2026 | +67.4% | +52.1% | SOXX +15.3pp |
| 1Y | +160.7% | +139.9% | SOXX +20.8pp |
| 3Y CAGR | +55.1% | +64.5% | SMH +9.4pp/yr |
| 5Y CAGR | +32.3% | +38.1% | SMH +5.8pp/yr |
| 5Y max drawdown | –45.8% | –45.3% | roughly equal |
| Annualised vol | 35.9% | 34.9% | roughly equal |
Two things stand out. First, drawdown and volatility are essentially identical — both ETFs lost about 46% from peak during the 2022 semis correction and both run at roughly 35% annualised volatility. The construction difference doesn’t show up in risk metrics; it shows up in return profile when one stock dominates. Second, the SOXX-wins / SMH-wins flip happens at the medium-term horizon: SOXX wins on the 1-year window because the rally has broadened, but SMH still wins on the 3-year and 5-year windows because NVDA’s run from 2023 onwards dominated those periods.
Cost, AUM, and liquidity
The expense ratios are functionally identical: SOXX 0.34%, SMH 0.35%. On a $10,000 position, that’s a $1/year difference — too small to matter for any normal investor. Ignore the fee comparison; it’s not the trade.
AUM is meaningfully different. SMH sits around $64 billion in assets; SOXX around $34 billion. SMH is roughly twice the size, which translates into tighter bid-ask spreads and deeper options chains. For investors holding either fund as a buy-and-hold core, the spread difference is invisible. For active traders rotating in and out at scale — or for options buyers needing decent volume on the weekly chains — SMH is the more liquid choice.
One more cost note: both ETFs are tax-efficient in the standard way ETFs are. We covered that mechanism in detail in ETFs vs Mutual Funds in 2026 — the in-kind redemption process means neither SOXX nor SMH typically distributes meaningful capital gains. That’s true for almost any modern equity ETF; it’s not a differentiator between these two.
AI exposure: which gives you more?
This is where the construction difference translates into something tangible for an AI-themed allocation.
If you define “AI exposure” narrowly as NVDA + TSM (the two names doing the most direct AI-chip revenue), SMH gives you ~27% combined weight. SOXX gives you ~13%. SMH is the higher-octane AI bet on that definition.
But “AI infrastructure” is broader than NVDA. The full AI chip stack includes memory (the HBM memory bottleneck sits with MU and SK Hynix, with MU being the US-listed proxy), packaging (the CoWoS shortage is a TSM story but also benefits AMAT and LRCX as packaging capacity is built out), and the custom silicon push from hyperscalers (covered in the custom silicon race). Memory and equipment make up a larger slice of SOXX than SMH — MU at ~9.6% in SOXX vs ~5.5% in SMH; the equipment trio (AMAT, LRCX, KLAC) is roughly 13% of SOXX vs ~14% of SMH (closer than the headline NVDA gap suggests).
The practical read: SMH is concentrated AI/compute exposure. SOXX is broader AI-infrastructure exposure. If you think GPU demand from hyperscaler training is the entire trade, SMH. If you think the rally broadens into memory, packaging, and equipment as the buildout cycle matures, SOXX.
When to pick which
The decision often comes down to what else is in the portfolio.
- Already own QQQ or VGT? Those broad tech ETFs already hold NVDA at ~8–9% weight. Adding SMH on top stacks NVDA exposure to ~3–4% of total portfolio with a 10% semis sleeve. Adding SOXX on top brings it to ~2%. SOXX is the better diversifier if you’re already long NVDA elsewhere.
- Building a thematic AI sleeve from scratch? SMH lets the AI cycle’s main beneficiaries dominate the position. That’s the point of a thematic bet.
- Tax-loss-harvesting between them? Some traders use SOXX and SMH as TLH partners — sell one at a loss, buy the other, harvest the loss without leaving the sector. They’re substantially similar but not identical, so the IRS wash-sale rule treatment is fuzzy. The conservative read is they’re similar enough that wash-sale might apply; the aggressive read is the construction difference makes them distinct. Tax professional territory.
- Trading options for short-term positioning? SMH’s larger AUM means tighter spreads and more weekly liquidity. SMH wins on tradability.
- Want exposure without making a cycle call? Hold both at 50/50. The construction difference creates a small natural rebalancing effect — when NVDA runs hot, SMH outperforms and you trim it back to SOXX; when the rally broadens, SOXX outperforms and the rebalance flows back. It’s not a free lunch, but it smooths the cycle.
What could break this picture
Three things would shift the SOXX vs SMH calculus.
First, a regulatory change to ETF concentration limits. The 8% cap on SOXX’s top-5 and the 20% cap on SMH’s individual positions are both functions of the underlying index methodologies, not regulatory floors. If either index sponsor changes the cap rule (more or less strict), the funds’ return profiles change with it. Watch the annual methodology refreshes from NYSE/Nasdaq and MVIS.
Second, an NVDA-specific shock. If NVDA’s market cap falls 30% on a competitive event (a hyperscaler defection to custom silicon, China revenue ban tightening, a Blackwell yield problem), SMH would take roughly 1.4x the hit SOXX would on the NVDA leg alone, because of the 2.5x weight differential. Neither ETF is hedged against single-name risk; the difference is how much single-name risk each one accepts by design.
Third, a structural decoupling between NVDA and the rest of the chip stack. So far the AI cycle has lifted everything in semis on different timescales. If NVDA keeps running but TSM, MU, AMD, and the equipment names stall (because the buildout cycle saturates while AI compute demand keeps growing), SMH would continue to outperform on construction. If the opposite — NVDA cools while the rest catches up — SOXX outperforms. The current YTD picture is closer to the second scenario.
Bottom line
SOXX vs SMH isn’t a coin flip and it isn’t a fee comparison. Same names, same fees, very different bets. SMH is a more concentrated NVDA + TSM position dressed up as a sector ETF, and over five years that concentration has compounded into ~5.8 percentage points per year of outperformance. SOXX is a genuinely broader semis basket, and over the last 12 months that diversification has paid off as the rally broadened beyond compute into memory and equipment. Pick the one whose construction matches the call you’re making about the AI cycle’s next leg.
Get early access to Orbit
Orbit is Luna3.ai’s AI-augmented research engine. 12 algorithmic signals + a gradient-boosted ML model + an agentic LLM that reads each top pick’s filings and writes a daily thesis with conviction score and catalyst proximity. Three regimes, three playbooks — growth in expansion, defensives in late-cycle, recovery plays at panic bottoms. The 3 in Luna3.ai.
No spam. Unsubscribe any time.
No comments yet. Be the first to share your thoughts!