
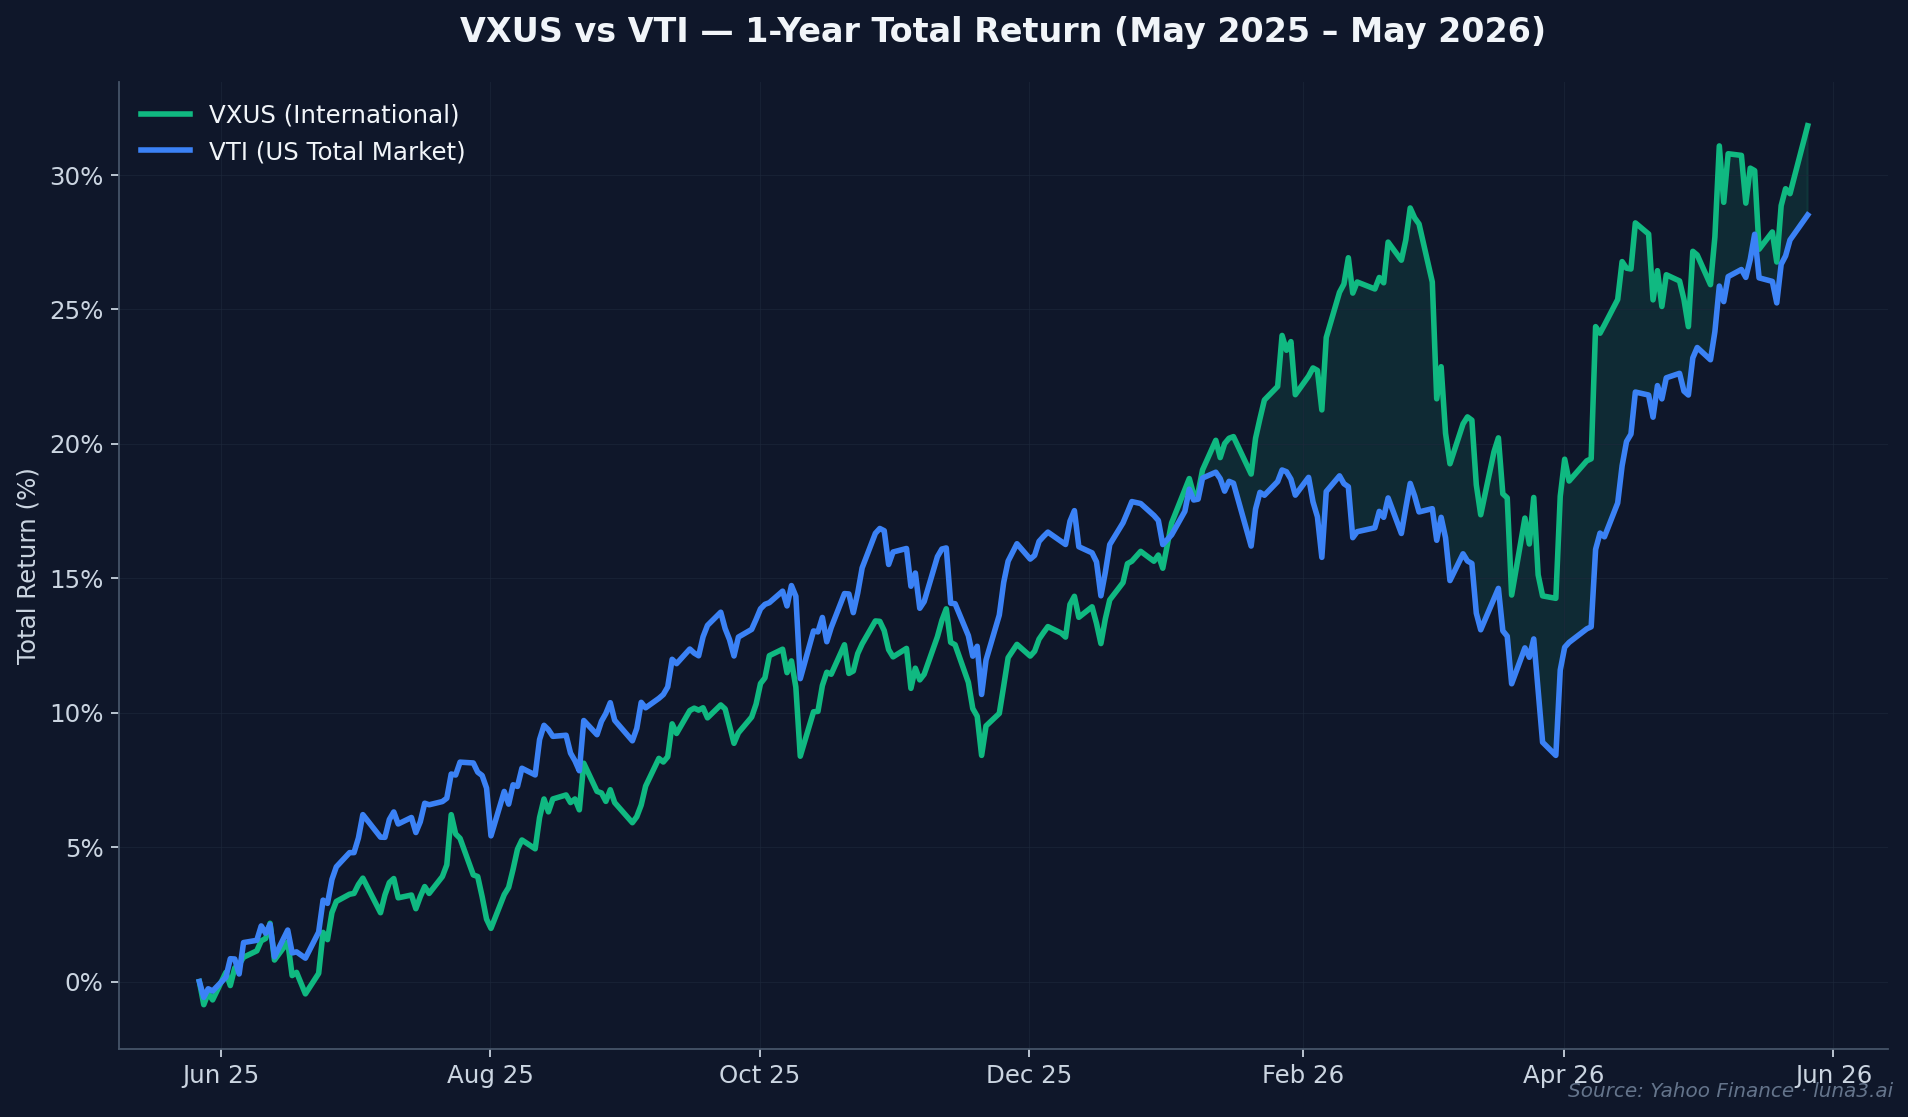
- VXUS led VTI by roughly 11 percentage points YTD through April 2026; by late May the gap had compressed to about 4pp as US stocks rebounded.
- The expense ratio difference is $20/year on a $100,000 portfolio — too small to drive the decision either way.
- What survives a one-quarter rally: VXUS P/E ~16x vs VTI ~29x, top-10 concentration 12% vs 34%, and a US dollar that consensus still expects to soften through H2.
The “VTI-only” consensus held for most of the past decade. Then April 2026 happened: VXUS, the Vanguard Total International Stock ETF, led VTI — the US total-market ETF — by roughly 11 percentage points year-to-date. Reddit threads on r/investing started asking whether the home bias had finally caught up to retail portfolios.
Six weeks later, US stocks rebounded. The VXUS vs VTI YTD gap compressed to about 4 percentage points by May 26: VXUS up 13.78%, VTI up 9.70% (per Yahoo Finance). On a $10,000 portfolio, that’s a $408 spread — not nothing, but a far cry from the regime change April hinted at.
So the question isn’t “is VXUS still winning?” It’s narrower and more useful: with VTI’s price-to-earnings ratio sitting around 29× and VXUS closer to 16×, with the dollar index flat YTD after a January-to-April slide, and with one stock (NVIDIA) now ~6.4% of VTI by itself, does the structural case for international exposure hold after the rotation cooled? Or was April the entire trade?
The trap most guides set
Most VXUS vs VTI comparisons argue from US-centric defaults. They start with VTI as the baseline, treat international as the “alternative,” and put the burden of proof on diversifying away from the US.
That framing was built at the end of the longest US bull market in modern history. Three things have shifted since 2024:
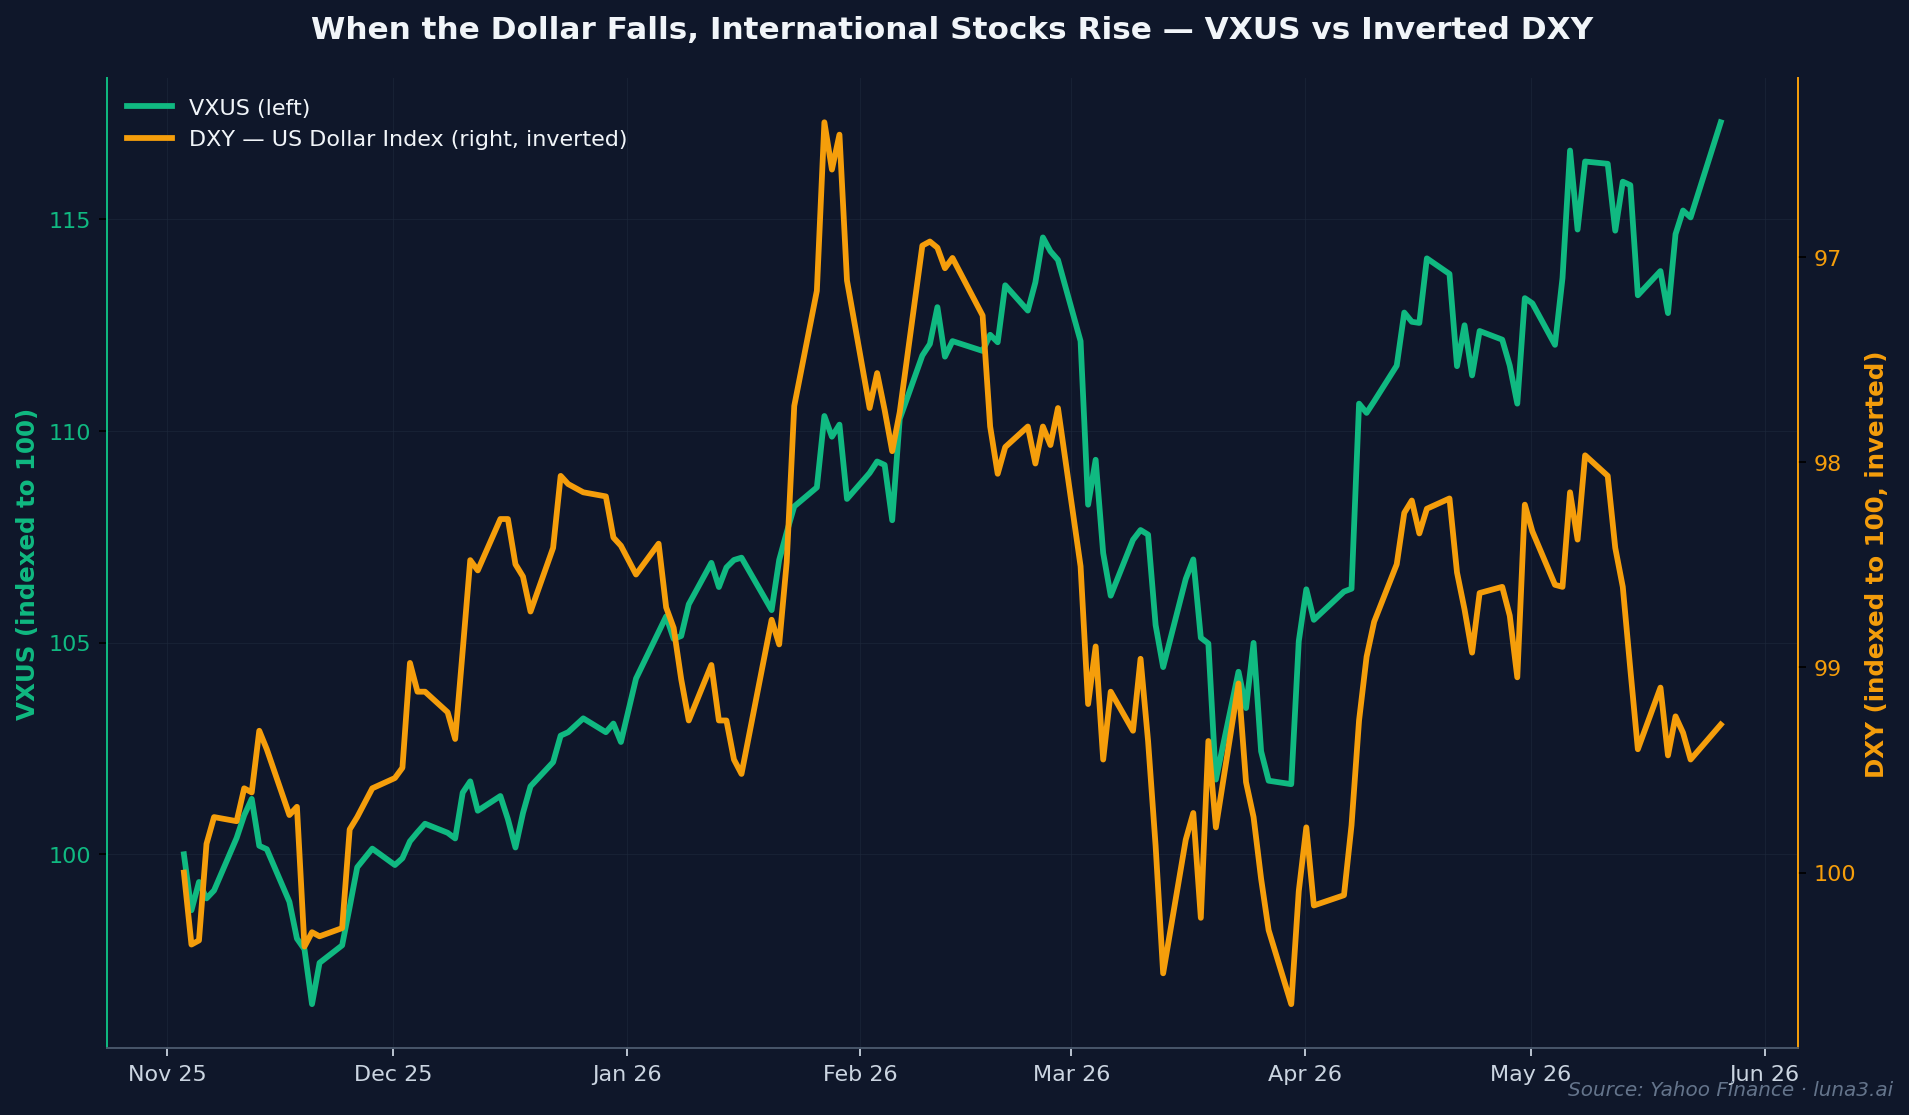
USD direction. The dollar index slid from January through April 2026, driven by Fed-policy uncertainty, Iran-related risk-premium unwinds, and a broad cyclical rotation away from US assets. By late May, DXY had stabilized in the high-90s, but every major bank consensus we’ve seen still pencils in a softer dollar through Q4 2026. Currency moves accrue directly to unhedged international holders.
Valuation gap. The S&P 500 trades at a forward earnings multiple of roughly 24×; VTI on a trailing basis sits closer to 29×. The MSCI ACWI ex-US index trades closer to 14-16× — a valuation discount that has widened over the past decade, not narrowed.
Single-stock concentration. The top 10 holdings of VTI now account for roughly 34% of the fund. NVIDIA alone is about 6.4%. That’s not “diversification across 3,500 US stocks” — it’s structural mega-cap concentration with a 3,500-stock long tail. The “but it owns the whole market” defense skips over the weighting.
The “but US companies have global revenue” counter — the idea that owning the S&P already gives you international exposure — has a similar blind spot. US stock prices still move with US market regime. Apple has ~57% international revenue (FY2025) but trades on US sentiment, US bond yields, and US dollar swings. Currency-translated earnings are not the same thing as currency-translated price action.
How the VXUS vs VTI choice actually works
Here’s what the two funds actually own and what they cost.
VXUS — Vanguard Total International Stock ETF holds roughly 8,800 stocks across 48 countries outside the US. The largest positions: Taiwan Semiconductor (3.87%), Samsung Electronics (1.63%), ASML (1.29%), SK Hynix (1.11%), and Tencent (around 1%). Top-10 concentration totals about 12% of the fund — meaningfully more diversified at the top than VTI. Expense ratio: 0.05%, which Vanguard lowered earlier in 2026 from 0.07%.
VTI — Vanguard Total Stock Market ETF holds roughly 3,500 US-listed stocks. The top names: NVIDIA (6.4%), Apple (5.9%), Microsoft (4.4%), Alphabet (~4.8% combined GOOG + GOOGL), Amazon (3.2%). Top-10 concentration totals around 34% — nearly triple VXUS’s. Expense ratio: 0.03%.
The expense ratio gap is small enough to ignore. On a $100,000 position, VXUS costs $50/year and VTI costs $30/year. The $20/year difference is real but trivially small — it works out to $1.67 per month, and it shouldn’t be the deciding factor either way.
Currency exposure is where the funds really diverge. When you buy VXUS, you’re effectively long both the underlying stocks and the foreign currencies those stocks are priced in. If the euro rises 5% against the dollar and European stocks are flat in euro terms, your VXUS exposure to European equities rises ~5% in dollar terms. Conversely, a strong dollar erodes unhedged international returns. The chart below — VXUS plotted against an inverted DXY index — shows that relationship across the past six months.
The valuation spread is the structural piece. VXUS trades at a price-to-earnings multiple of roughly 14-17× depending on the source; VTI sits closer to 29×. The gap isn’t new — international has traded at a discount to US for most of the past 15 years — but the magnitude is unusual. A 50-60% valuation discount embeds an implicit assumption that US earnings will grow much faster than international earnings indefinitely. That’s a heavier assumption than most retail portfolios consciously make.
The 2026 numbers
Head-to-head, with figures from Vanguard fact sheets (March 31, 2026) and Yahoo Finance pricing (May 26, 2026):
| Metric | VXUS | VTI |
|---|---|---|
| Expense ratio | 0.05% | 0.03% |
| Holdings | ~8,800 stocks across 48 countries | ~3,500 US stocks |
| 1-year total return | +31.83% | +28.51% |
| YTD 2026 return | +13.78% | +9.70% |
| P/E ratio (approx) | ~16× | ~29× |
| Top holding | TSMC (3.87%) | NVIDIA (6.4%) |
| Top-10 concentration | ~12% | ~34% |
| Dividend yield (TTM) | ~2.8% | ~1.0% |
| Currency exposure | Unhedged foreign currencies | USD only |
On a $10,000 one-year hold (May 26, 2025 → May 26, 2026):
- $10,000 in VXUS = $13,183 today
- $10,000 in VTI = $12,851 today
- Spread: +$332 to VXUS
On a $10,000 YTD hold (January 1, 2026):
- $10,000 in VXUS = $11,378 today
- $10,000 in VTI = $10,970 today
- Spread: +$408 to VXUS
The April peak — when VXUS was up double digits YTD while VTI was roughly flat — is what made VXUS the dominant retail rotation theme. What’s notable is that even after US stocks staged a strong May rebound, VXUS held its lead. Narrower, but not erased. That’s a different reading of the rotation than “April was the trade.”
Where beginners get the VXUS vs VTI call wrong
1. Treating VTI-only as “diversified.” It isn’t — it’s a country bet. The US is roughly 60% of global equity market capitalization. Holding 100% VTI in your equity allocation embeds an active 40-percentage-point overweight to one country. That can absolutely be the right call. Calling it “diversified” hides the bet.
2. The global-earnings fallacy. “But Apple has international revenue” is a real point about underlying business exposure — and it’s also not how the stock price behaves. When the Fed surprises or US Treasury yields spike, Apple moves with US sentiment, not with the currencies of its end markets. Operating revenue is not the same as price return.
3. Underweighting the foreign tax credit recoup. VXUS pays a higher dividend yield than VTI (~2.8% vs ~1.0% trailing twelve months) and foreign withholding taxes can typically be claimed back via IRS Form 1116 in a taxable account. In a tax-advantaged account (IRA, 401(k), Roth), the foreign withholding is generally lost — which is why most allocation models that include international weight those funds in taxable accounts first when the choice is available.
4. Overstating currency risk. Unhedged international funds have absolutely produced periods of underperformance during USD strength — that risk is real. Across the historical record, though, USD-weak periods have produced markedly higher international returns. The currency story is bidirectional, not one-way.
Going deeper
If you’re still on the US side of the decision tree, our breakdown of VOO vs VTI covers the narrower call between Vanguard’s two US ETFs. For why the active-vs-passive debate matters — and where $640B in outflows from active funds went last year — see Active vs Passive Funds: Why $640B Walked Out of Active in 2025. And for the long-tail erosion most investors miss when they ignore the basis-point spread between funds, our piece on ETF expense ratios walks through the math.
For the underlying fund details — current holdings, country breakdown, expense ratio history — Vanguard’s own VXUS product page is the authoritative source.
The rotation cooled. The structural math didn’t.
Get early access to Orbit
Orbit is Luna3.ai’s AI-augmented research engine. 12 algorithmic signals + a gradient-boosted ML model + an agentic LLM that reads each top pick’s filings and writes a daily thesis with conviction score and catalyst proximity. Three regimes, three playbooks — growth in expansion, defensives in late-cycle, recovery plays at panic bottoms. The 3 in Luna3.ai.
No spam. Unsubscribe any time.
No comments yet. Be the first to share your thoughts!