- The three big "uranium" funds are not one trade: URA spreads across the whole nuclear fuel cycle, URNM is concentrated miners plus physical uranium (the highest-beta version), and NLR tilts toward the utilities actually signing the hyperscaler power deals — and is the only one that pays a yield.
- Cameco is a top holding in all three (roughly 21% of URNM by itself), so owning two of them stacks the same name rather than diversifying.
- Over the past year all three returned between 40% and 65%, but carried about four times the S&P 500's volatility and 26–32% drawdowns. They are unleveraged funds, but the ride is anything but smooth.
The hardest constraint in the AI build-out isn’t chips — it’s gigawatts. Training and serving frontier models needs always-on, carbon-free baseload power, and the cleanest place the public market has found to express that is nuclear. That’s why retail keeps reaching for a uranium ETF to ride the theme. The problem: the three funds most people mean when they say “uranium ETF” — Global X’s URA, Sprott’s URNM, and VanEck’s NLR — are not interchangeable. They sit at three different points on the same value chain, and the one you hold decides whether you’re betting on the uranium price, the miners, or the utilities.
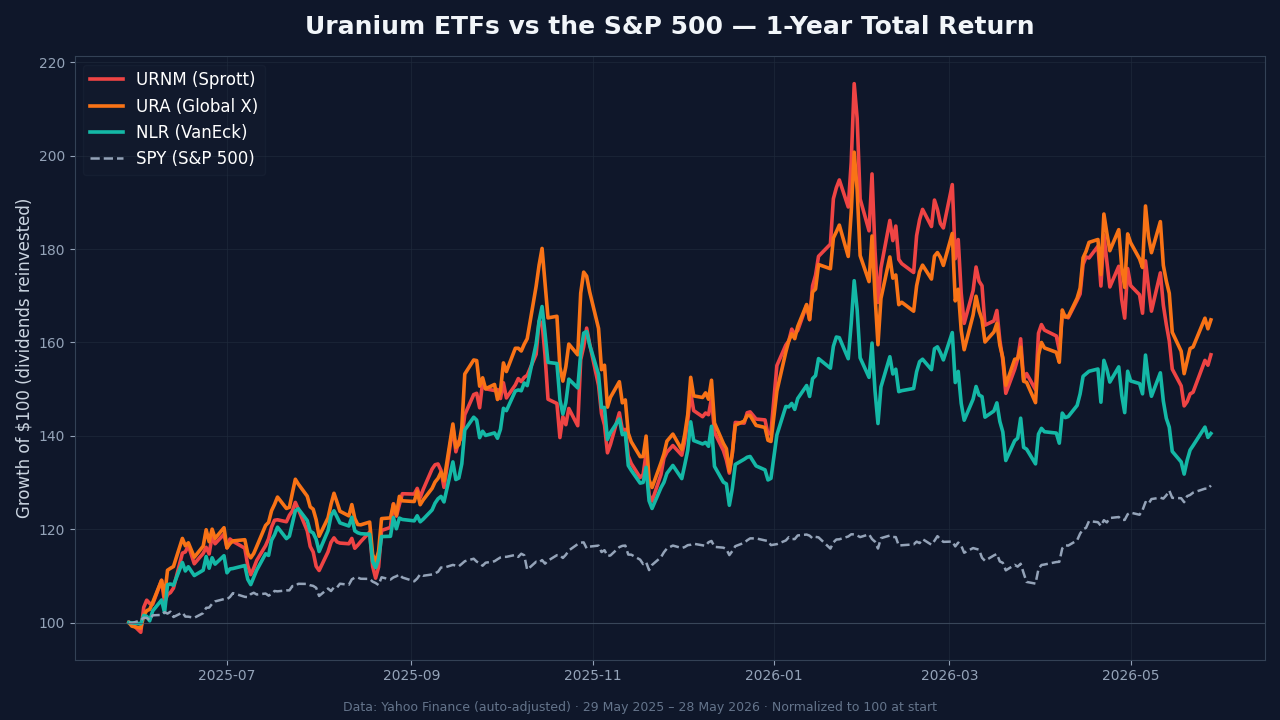
URA is the one most investors find first. The fund last changed hands at $50.75 heading into publication on May 29, 2026, up roughly 65% over the trailing twelve months — a move that has dragged the whole category into the conversation. But “up 65%” tells you nothing about what you actually own, and that’s where the three funds split apart.
Why the AI power crunch routes to nuclear
Data-center electricity demand is the part of the AI story the chip headlines skip. The IEA’s electricity outlook has flagged data centers as one of the fastest-growing sources of new load this decade, and the grid can’t add firm, 24/7 supply fast enough. Renewables are intermittent; gas carries carbon and permitting baggage. Nuclear is the one source that is firm, carbon-free, and already sitting on the grid — which is exactly why the hyperscalers stopped waiting and started signing directly with reactor operators.
- Amazon–Talen: a long-term agreement (running through 2042) to buy up to 1.92 GW from Talen’s Susquehanna plant in Pennsylvania, announced June 2025 alongside Amazon’s ~$20B Pennsylvania investment.
- Microsoft–Constellation: a 20-year deal to restart the 835 MW Three Mile Island Unit 1 (now renamed the Crane Clean Energy Center), signed September 2024, a ~$1.6B project targeting a 2027 startup.
- Meta–Constellation: a 20-year offtake of the 1.1 GW Clinton Clean Energy Center in Illinois, extending the life of a plant that was facing closure.
Each of those deals is a multi-decade revenue contract for an existing reactor — and a signal that the demand is structural, not a headline. It’s the same pressure we’ve traced through the rest of the AI-infrastructure stack, from why grid queues now outrank reactor builds to the SMR build-out behind the hyperscaler energy bet and the cooling chokepoint that follows power. The ETFs are simply the one-click wrapper around that thesis. What’s inside the wrapper is the whole question.
What each uranium ETF actually owns
Strip away the marketing and the three funds line up on three axes: how broad the basket is, how much it leans on the uranium price versus the utilities, and what it costs. Here’s the map (figures as of late May 2026 — AUM and yield drift, so treat them as the shape of the thing, not gospel):
| Fund | Issuer | Expense ratio | AUM (≈) | What it holds | Yield |
|---|---|---|---|---|---|
| URA | Global X | 0.69% | ~$7.6B | Broad fuel cycle — miners, enrichers, reactor & equipment names | low |
| URNM | Sprott | 0.75% | ~$2.4B | Pure-play miners + physical uranium (~31 holdings) | none |
| NLR | VanEck | 0.56% | ~$5.1B | Utilities + miners (income tilt) | ~0.5% |
URA casts the widest net. It’s the largest of the three by assets and reaches beyond miners into enrichment and reactor-equipment names — the broadest single proxy for “the nuclear supply chain.” URNM is the purest uranium bet: Sprott’s fund tracks a uranium-mining index and holds the Sprott Physical Uranium Trust directly, so a slice of the fund is the commodity. Its verified top holdings run Cameco (~21%), the Sprott Physical Uranium Trust (~14%), NexGen Energy (~12%), and then Uranium Energy and Energy Fuels — a concentrated book of ~31 names. NLR is the odd one out and the cheapest: VanEck’s fund weights toward the utilities and large operators — the kind of names actually signing the hyperscaler PPAs — and it’s the only one of the three that pays a meaningful distribution.
The overlap nobody flags: Cameco is a top holding in all three. It’s roughly a fifth of URNM by itself, and a major position in URA and NLR too. If you hold two of these funds thinking you’ve diversified the trade, you’ve mostly doubled down on one Canadian miner.
And the performance isn’t a clean “more concentrated equals more return.” Over the trailing year URA (+64.8%) actually edged URNM (+57.3%), while NLR’s utility tilt lagged the miners at +40.5% — still a comfortable 11 points ahead of the S&P 500’s +29.4%.
Spot uranium, miners, utilities: three different bets
The reason the funds diverge is that they sit at different points on the same chain, and each point behaves differently.
- Spot uranium (held via the Sprott Physical Uranium Trust inside URNM and, to a smaller degree, URA) is the commodity itself — the purest and most volatile expression. When the uranium price runs, this is the cleanest beta; when it stalls, there’s no operating business underneath to cushion it.
- Miners (Cameco, Kazatomprom, NexGen, Uranium Energy) carry operating leverage to that price — plus their own production, permitting, and single-country risk. This is the bulk of URA and URNM.
- Utilities (the Constellation/Vistra-type operators, heaviest in NLR) are the cash-flowing end of the chain. They capture the hyperscaler PPAs directly, carry the lowest commodity beta, and are the closest thing to a pure “AI-power-demand” play rather than a “uranium-price” play.
That framing also clears up a common misconception. None of these are small-modular-reactor pure-plays. The SMR story is real, but HALEU fuel supply is still the bottleneck and most SMR revenue is an early-2030s event — Oklo’s first pilot reactor is targeted for 2027–28, not 2026. The funds own today’s uranium miners and today’s nuclear utilities; the SMR optionality is a thin slice, not the engine.
The concentration and volatility traps
The single biggest thing the “3 ETFs that own the trade” listicles leave out is how violent these funds are. Uranium equities are a small, sentiment-driven corner of the market, and the price of that is volatility most index investors never experience.
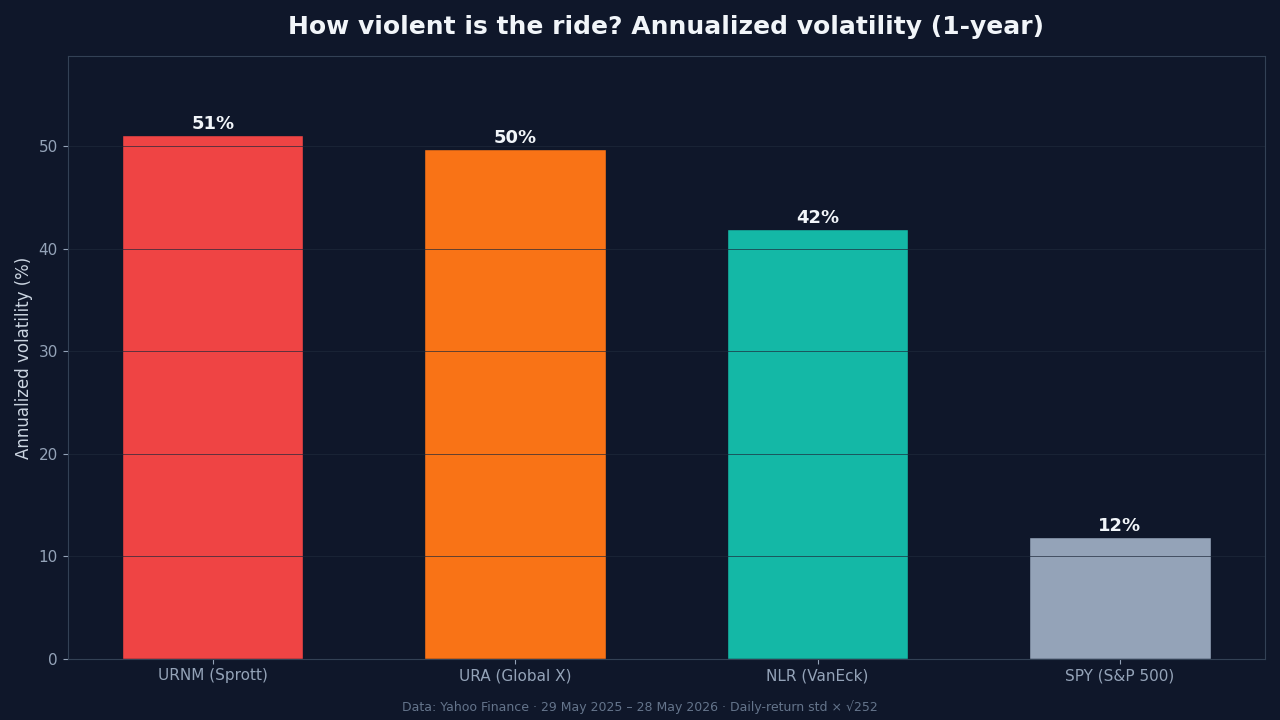
Over the past year URNM ran a ~51% annualized volatility, URA ~50%, and even the “calmer” NLR ~42% — against roughly 12% for the S&P 500. That’s about four times the index’s wobble. The drawdowns matched: inside that same up year, URNM still fell 32% peak-to-trough, URA 28%, and NLR 26%. The funds went up a lot and still put holders through stomach-churning declines along the way.
Two more structural traps sit underneath the volatility:
- Concentration and single-country risk. A handful of names dominate each fund, and Kazatomprom — held in URA and URNM — anchors a big share of global supply to Kazakhstan, with all the political and logistical risk that carries.
- Liquidity. URNM is the thinnest of the three by assets, which means wider spreads and more slippage versus net asset value when volume dries up.
One thing these funds are not: leveraged. Unlike a daily-reset 2x or 3x product, they don’t suffer the structural decay that grinds leveraged ETFs down over time. The drags here are the expense ratio, the premium or discount the physical-uranium sleeve can trade at, and the simple fact that momentum cuts both ways.
What we’re watching
The tells that separate a structural re-rating from a sentiment spike are observable, and they’re not the fund prices themselves:
- The uranium spot price and the SPUT premium/discount — the cleanest read on whether the commodity leg is leading or lagging the equities.
- The cadence of new hyperscaler–utility PPAs — each new contract is demand confirmation; a dry spell is the first thing to watch.
- HALEU supply and SMR permitting milestones (Oklo, NuScale) — the gating items on whether the early-2030s story stays on schedule.
- The miner-versus-utility spread (URNM vs NLR) — when utilities lead, the market is paying for power demand; when miners lead, it’s paying for the uranium price. That rotation is the regime tell.
- Fund flows — the same lens we used to map where ETF money is actually going applies here: sustained creations into URA/URNM signal conviction, while a flow reversal usually shows up before the price does.
The bottom line is the one the category’s cheerleaders skip: “buy a uranium ETF” is three different decisions wearing one ticker shape. URA is the broad basket, URNM is the high-octane commodity-and-miner bet, and NLR is the cash-flowing utility tilt that most resembles the AI-power-demand story the headlines are actually about. Knowing which one is on the screen — and that Cameco is sitting in all three — is the difference between owning the thesis you think you own and owning a more concentrated, more volatile version of it.
Get early access to Orbit
Orbit is Luna3.ai’s AI-augmented research engine. 12 algorithmic signals + a gradient-boosted ML model + an agentic LLM that reads each top pick’s filings and writes a daily thesis with conviction score and catalyst proximity. Three regimes, three playbooks — growth in expansion, defensives in late-cycle, recovery plays at panic bottoms. The 3 in Luna3.ai.
No spam. Unsubscribe any time.
No comments yet. Be the first to share your thoughts!